

Financial analysis in minutes, not days
Slice, dice, and forecast your pipeline, ARR, and churn, no csv's or custom formulas required.


Finance and GTM teams don’t struggle because they lack insight—they struggle because critical data is fragmented, manual, and slow to work with. Answering even simple questions requires stitching together systems, rebuilding metrics, and relying on a single analyst, turning routine analysis into a time-consuming process.
Models are built on guesswork.
Revenue and customer data lives across multiple systems, requiring merging csvs to reconcile.
Every metric has to be rebuilt from scratch
All ARR, revenue, and retention formulas need to be built from scratch, which slows down analysis and introduces errors.
New questions mean rebuilding from scratch
Seeing new cuts or segments of data means hours of rebuilding analysis from scratch.
Spreadsheets go stale the moment they’re created
Spreadsheets immediately get out of date, and updating means more csv downloads and data merging.
One analyst becomes the company bottleneck
One analyst becomes the bottleneck for every ad hoc request. As a result, teams spend more time preparing data than analyzing it.
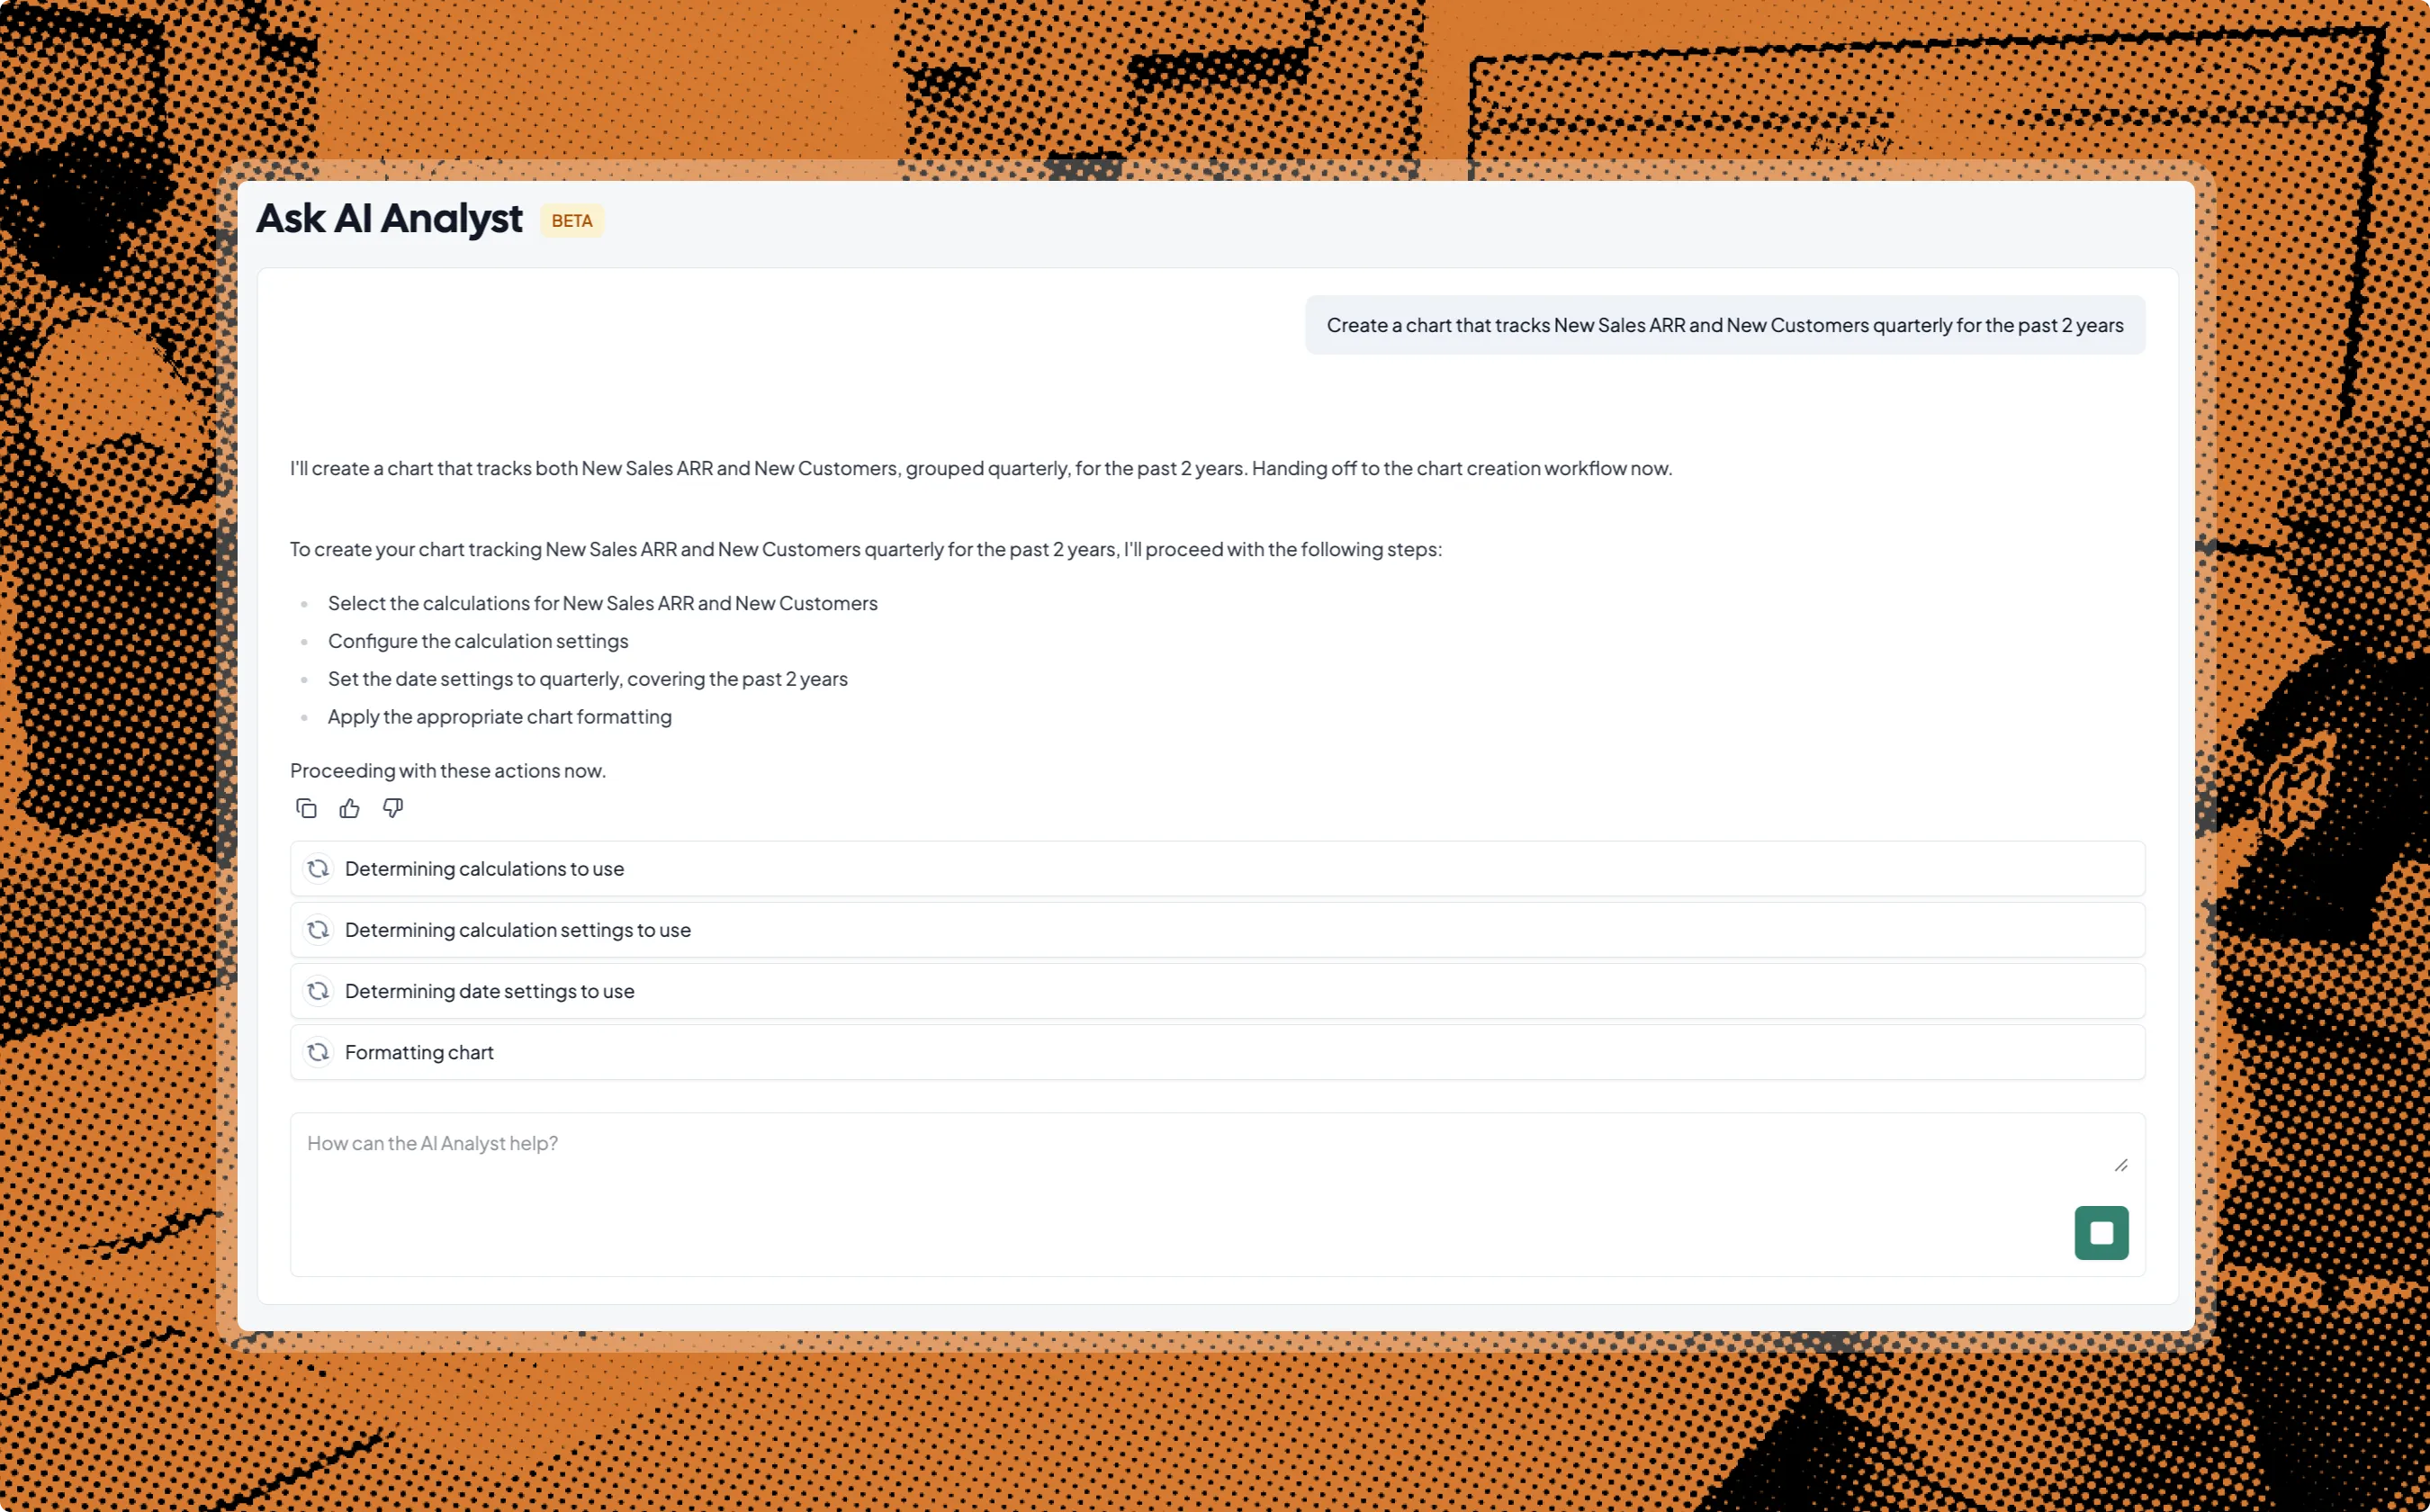
Our AI analyst is like your new coworker – it understands your data, is a master of SaaS metrics, and can instantly create new charts and reports.

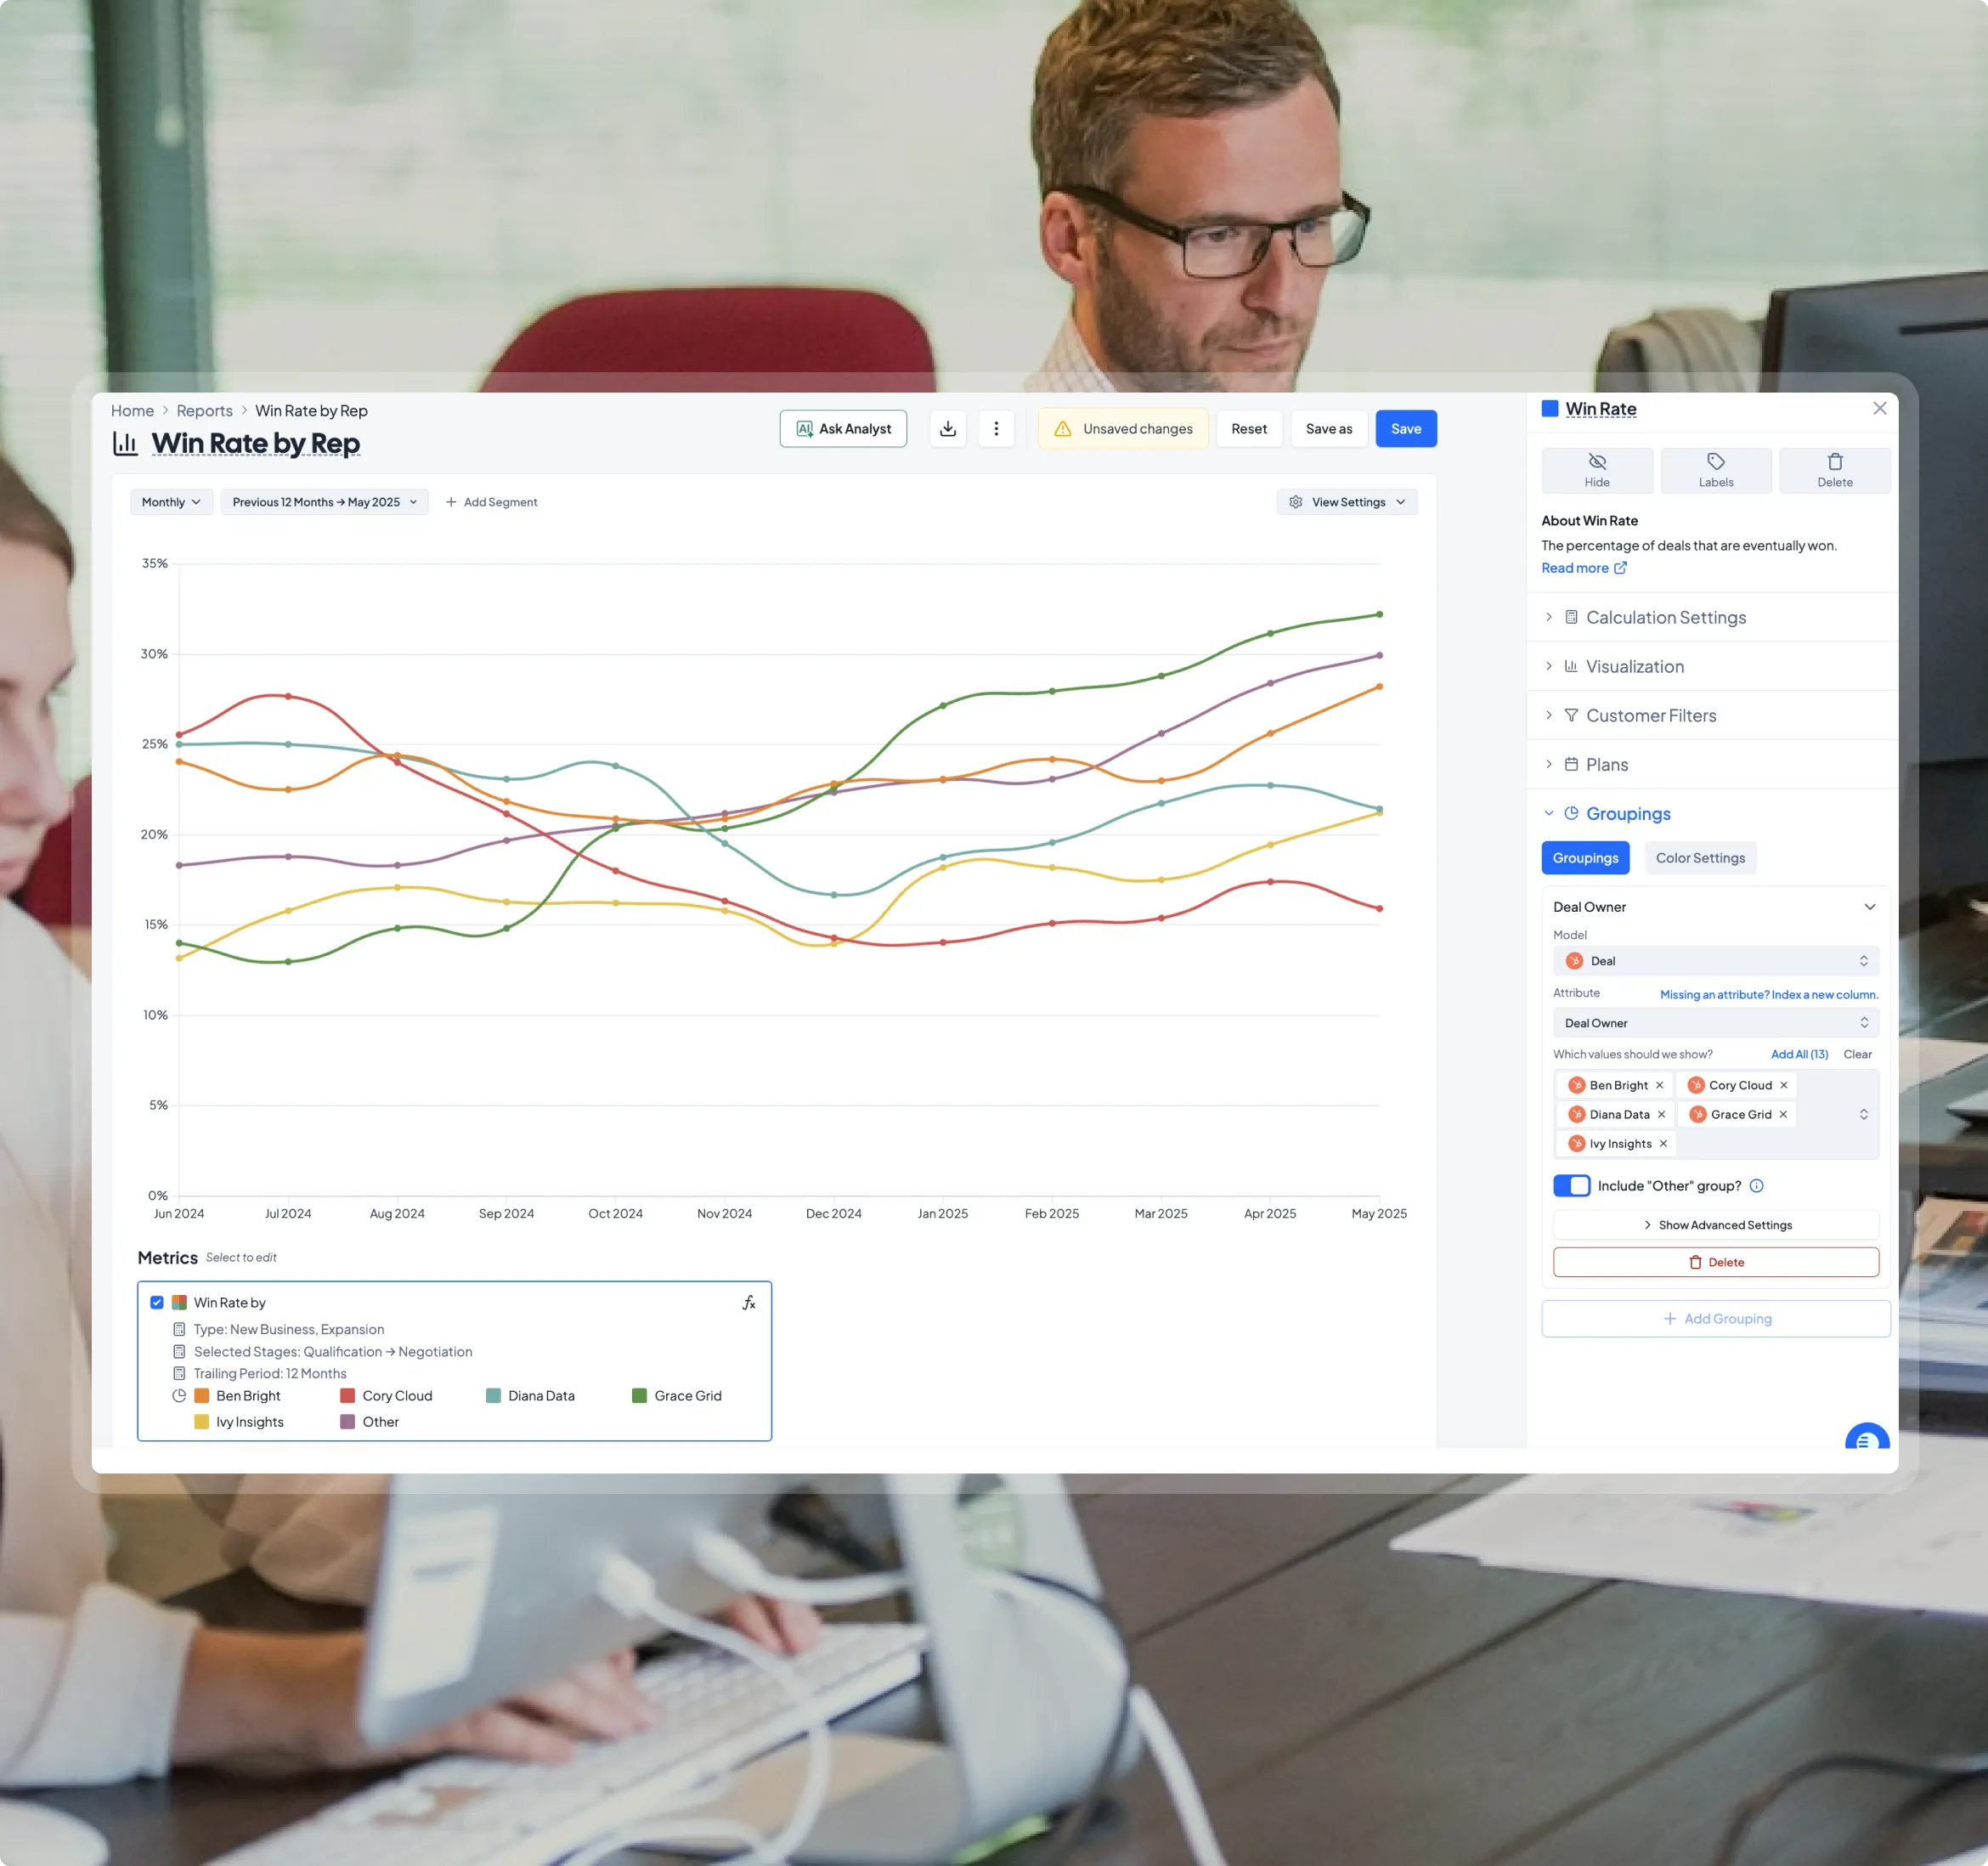
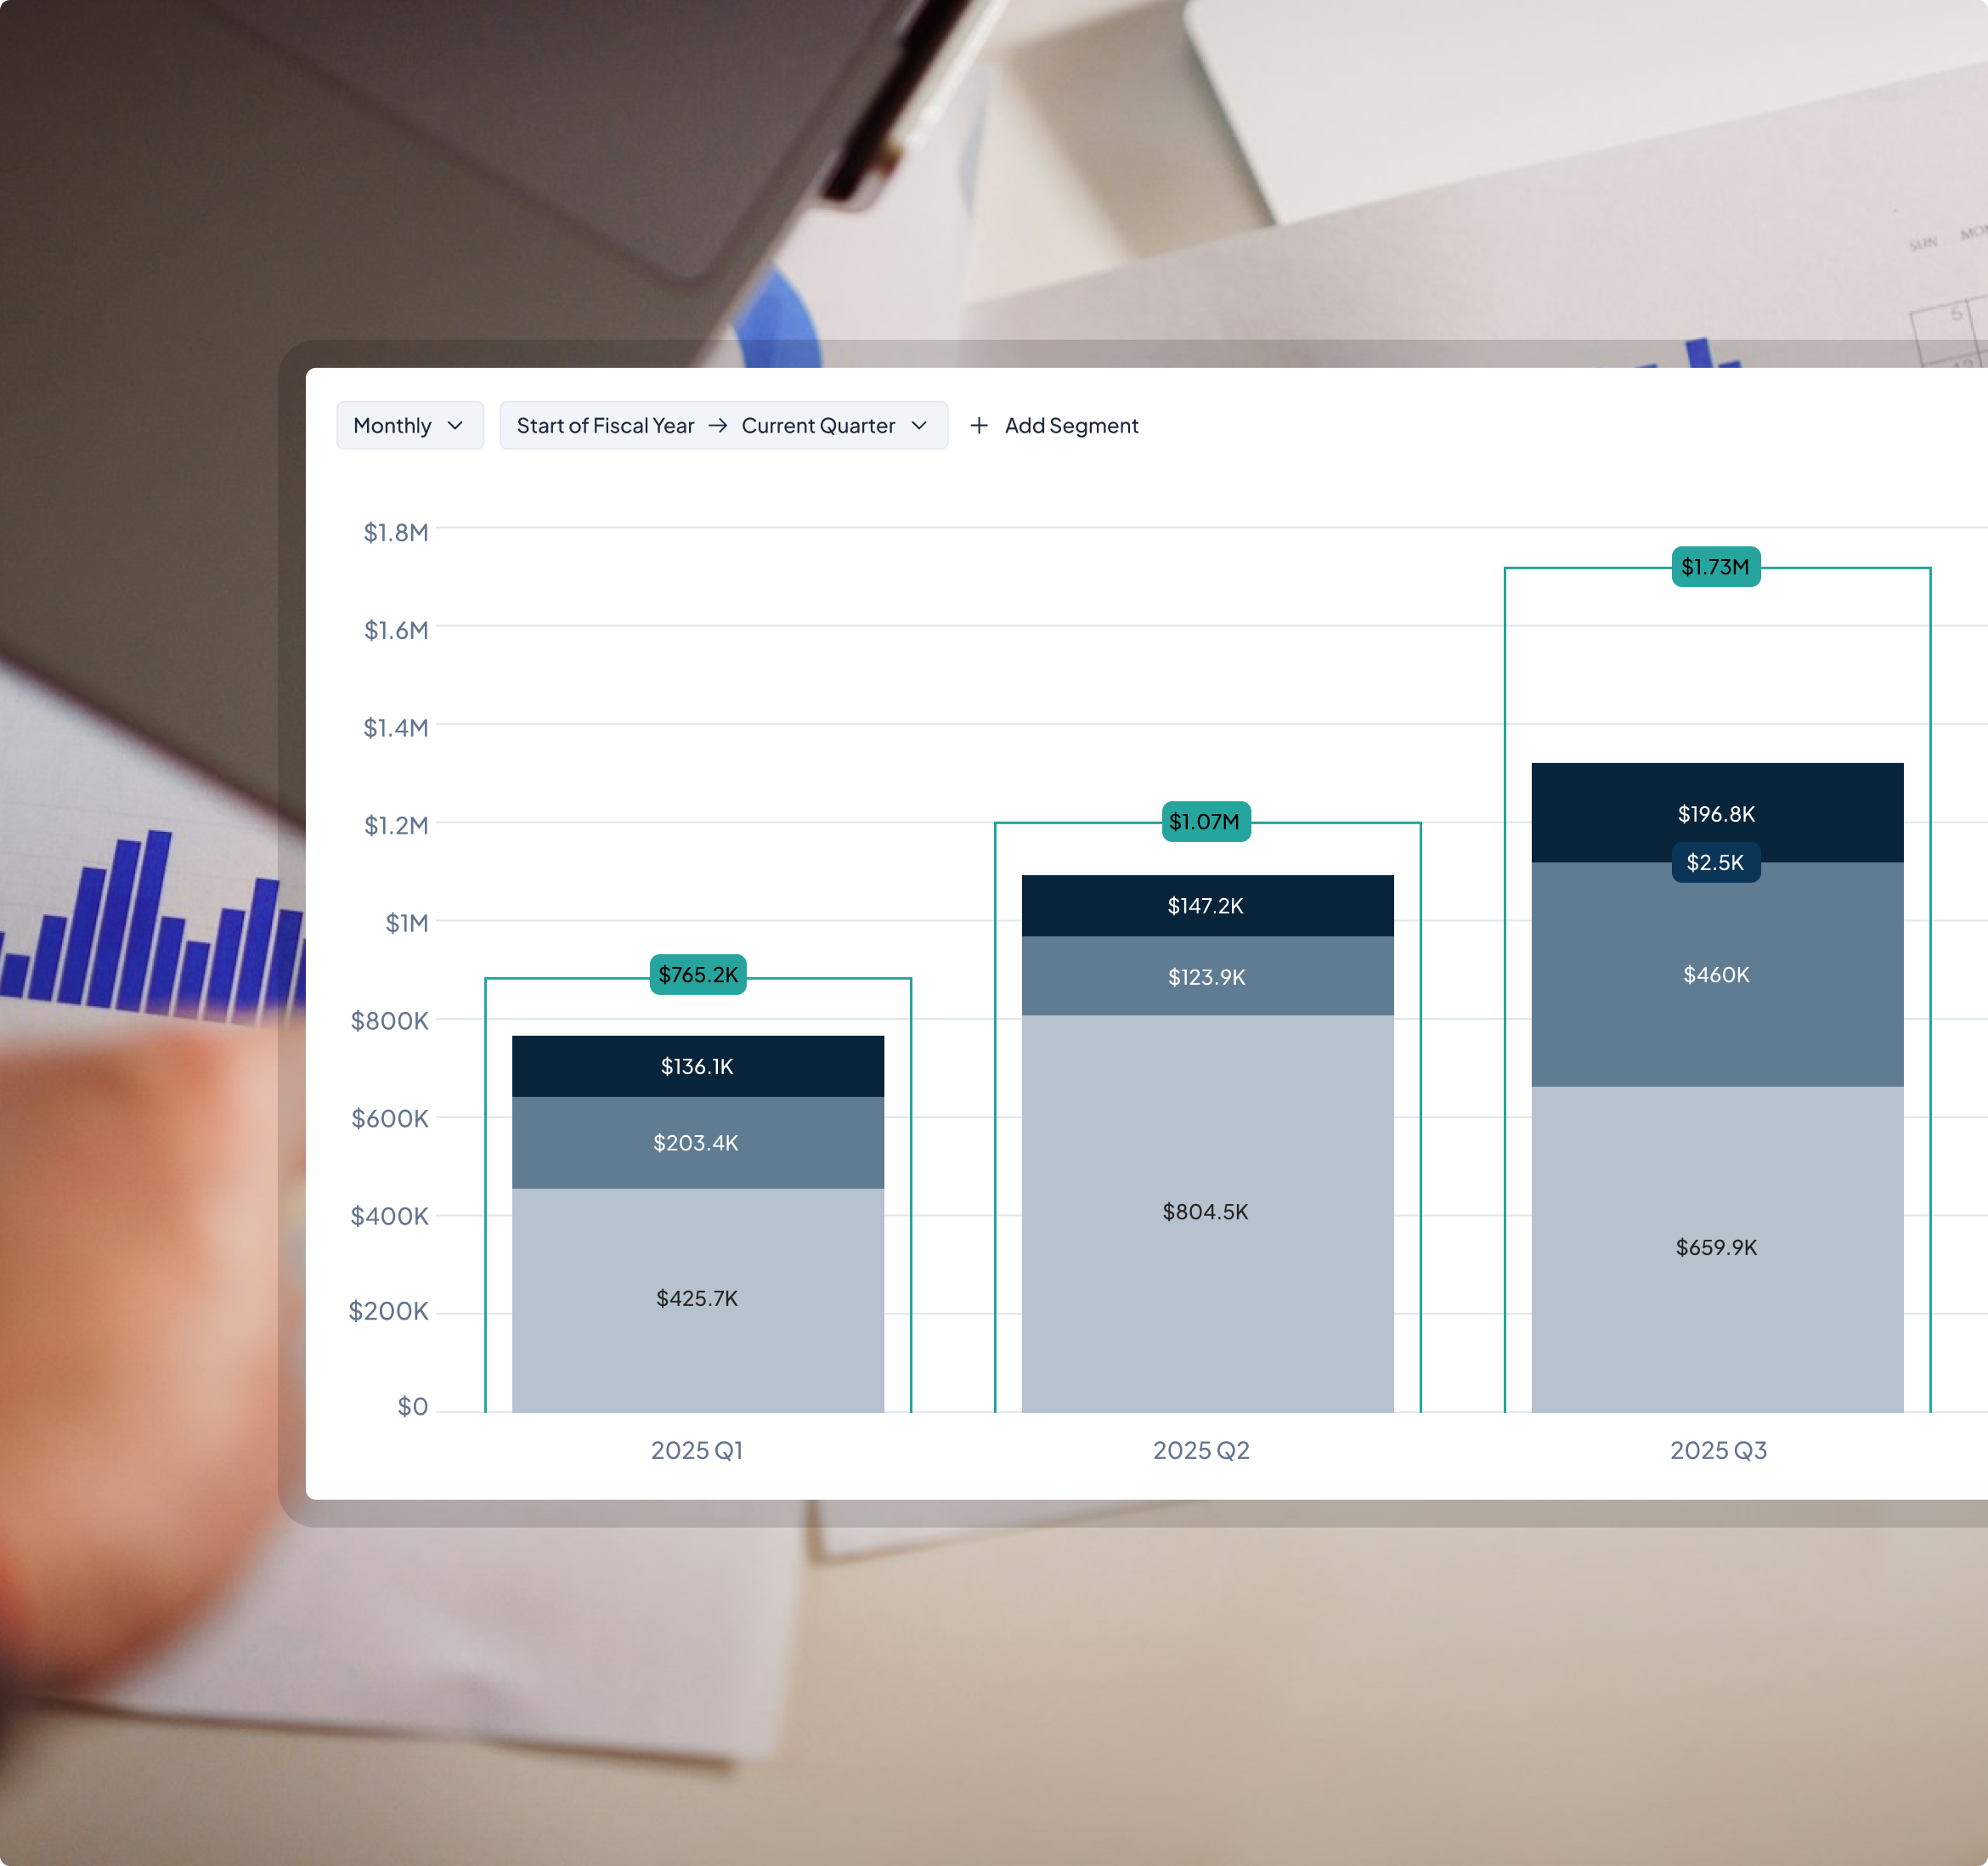
Break down your data by any attribute using our advanced segment builder. Explore new cuts of data in seconds without rebuilding your analysis from scratch.
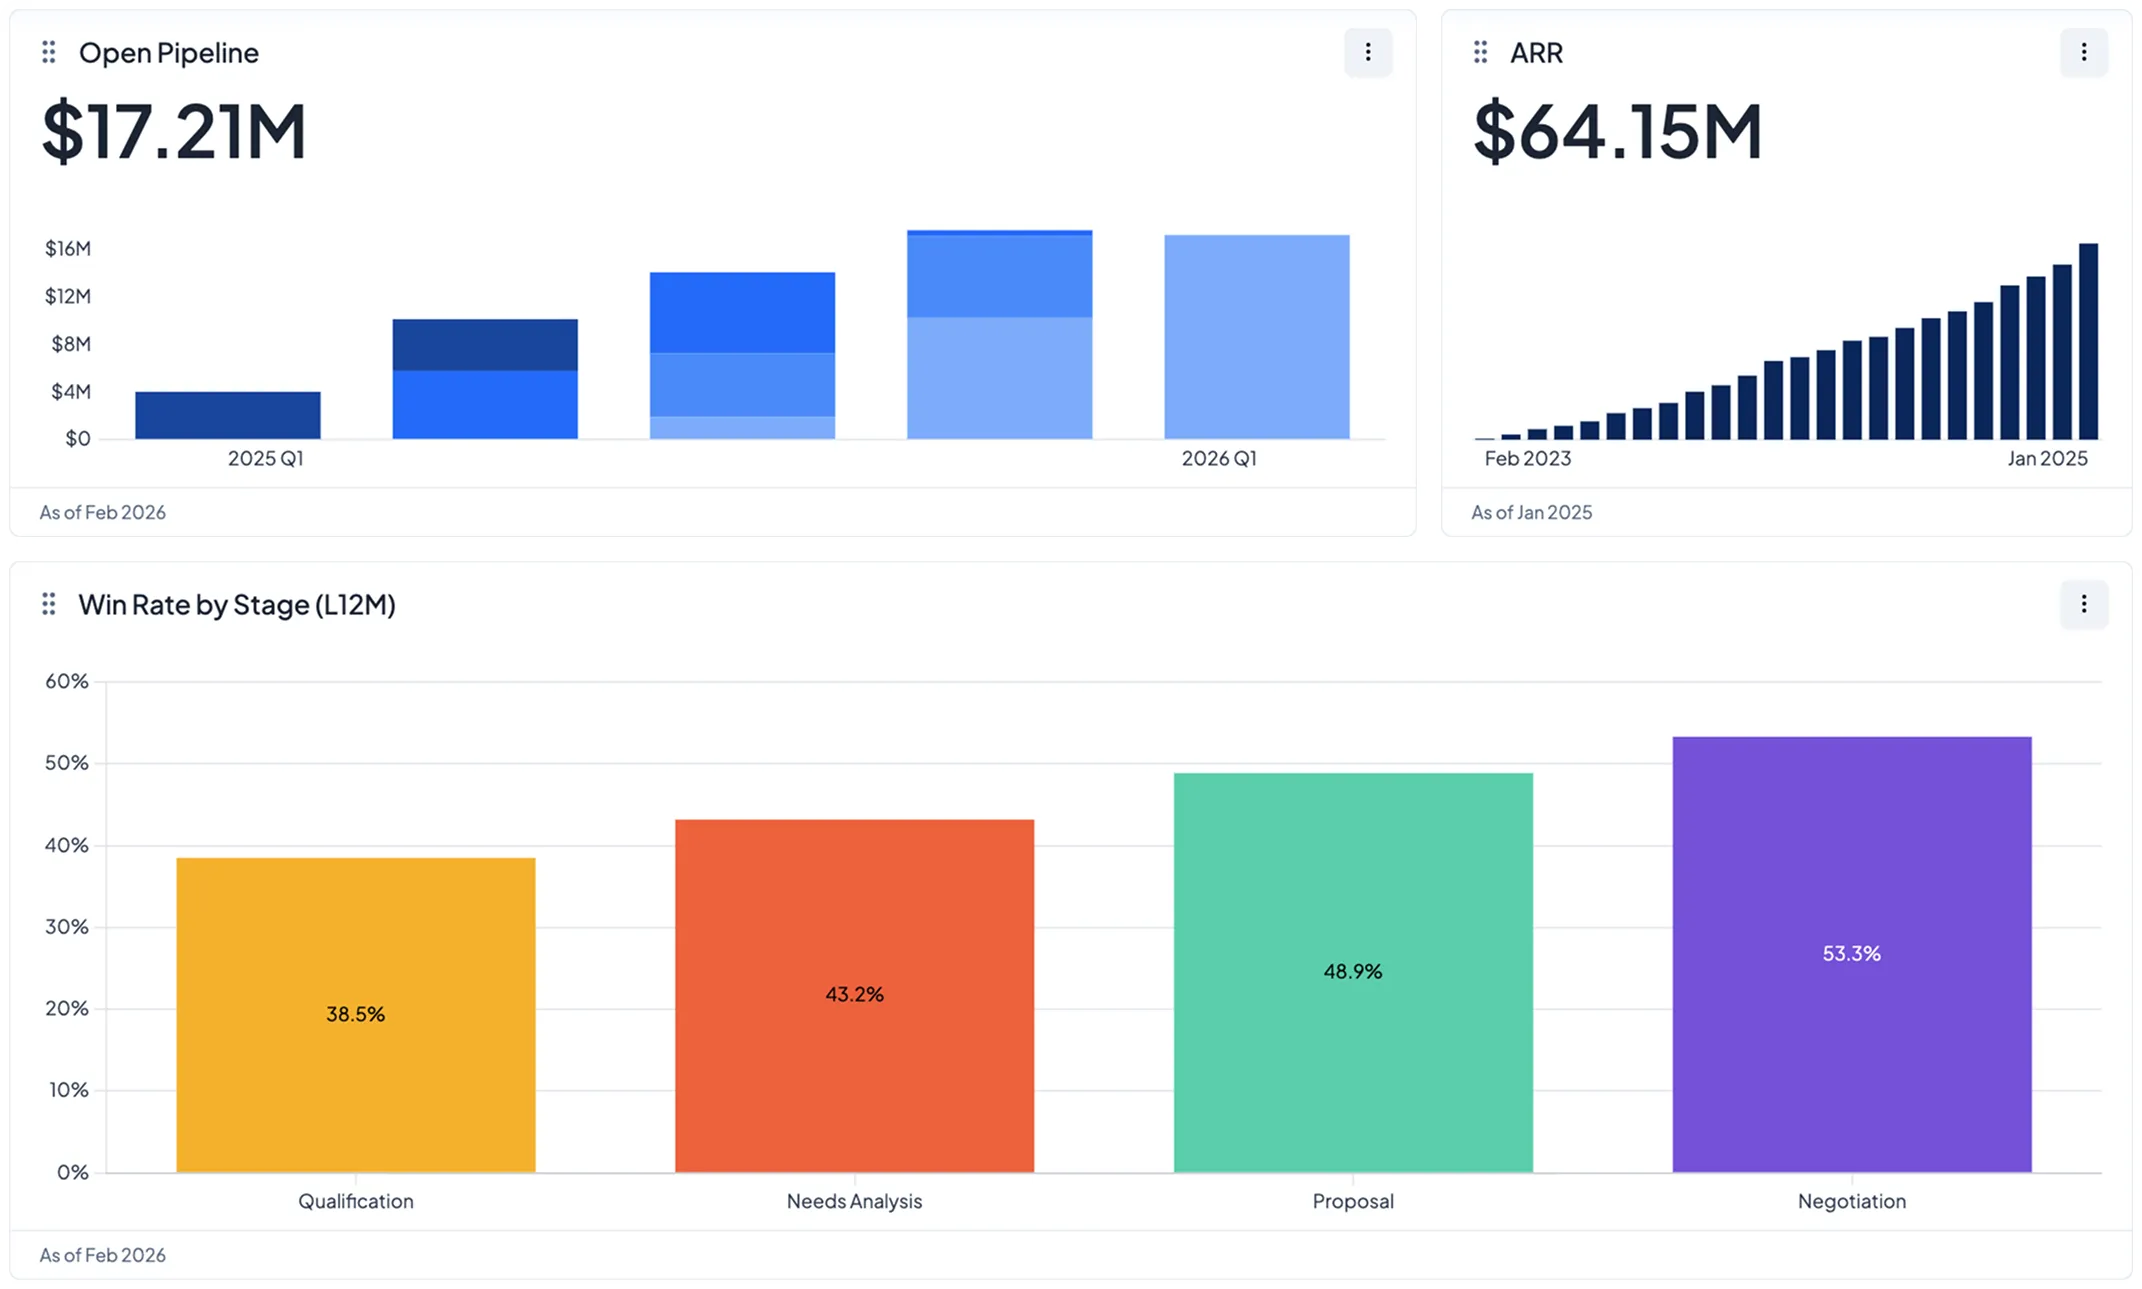
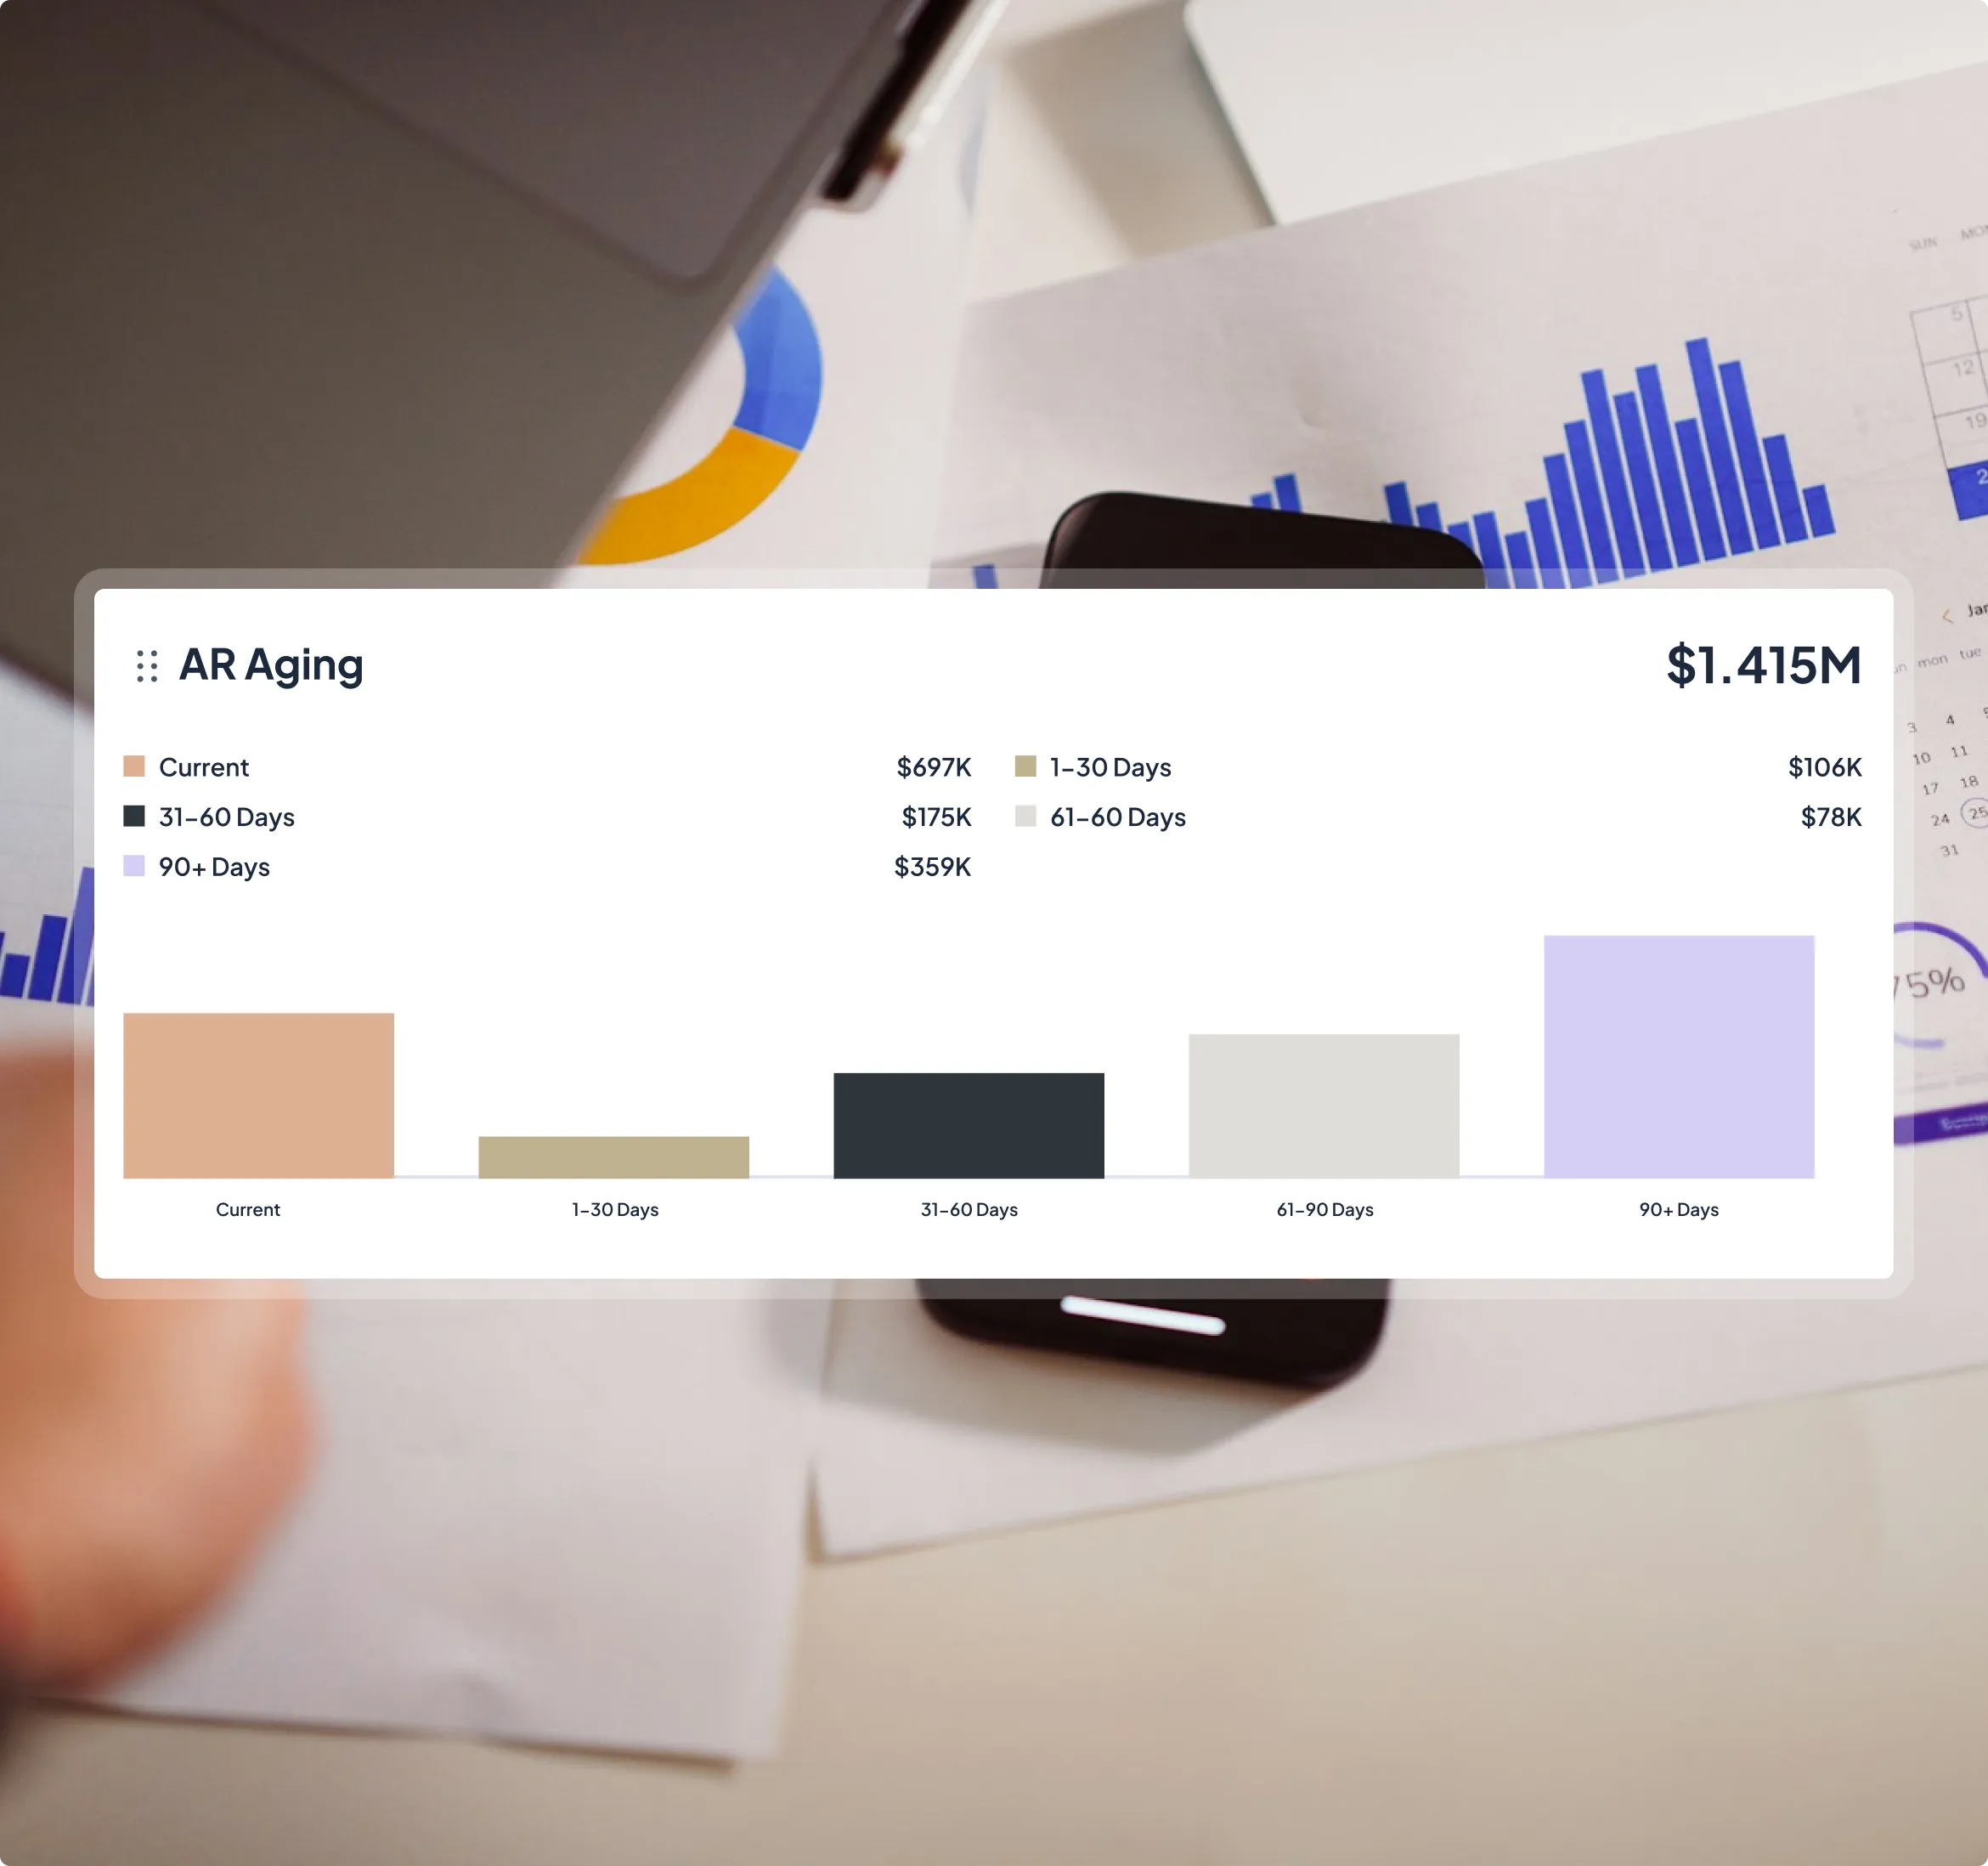
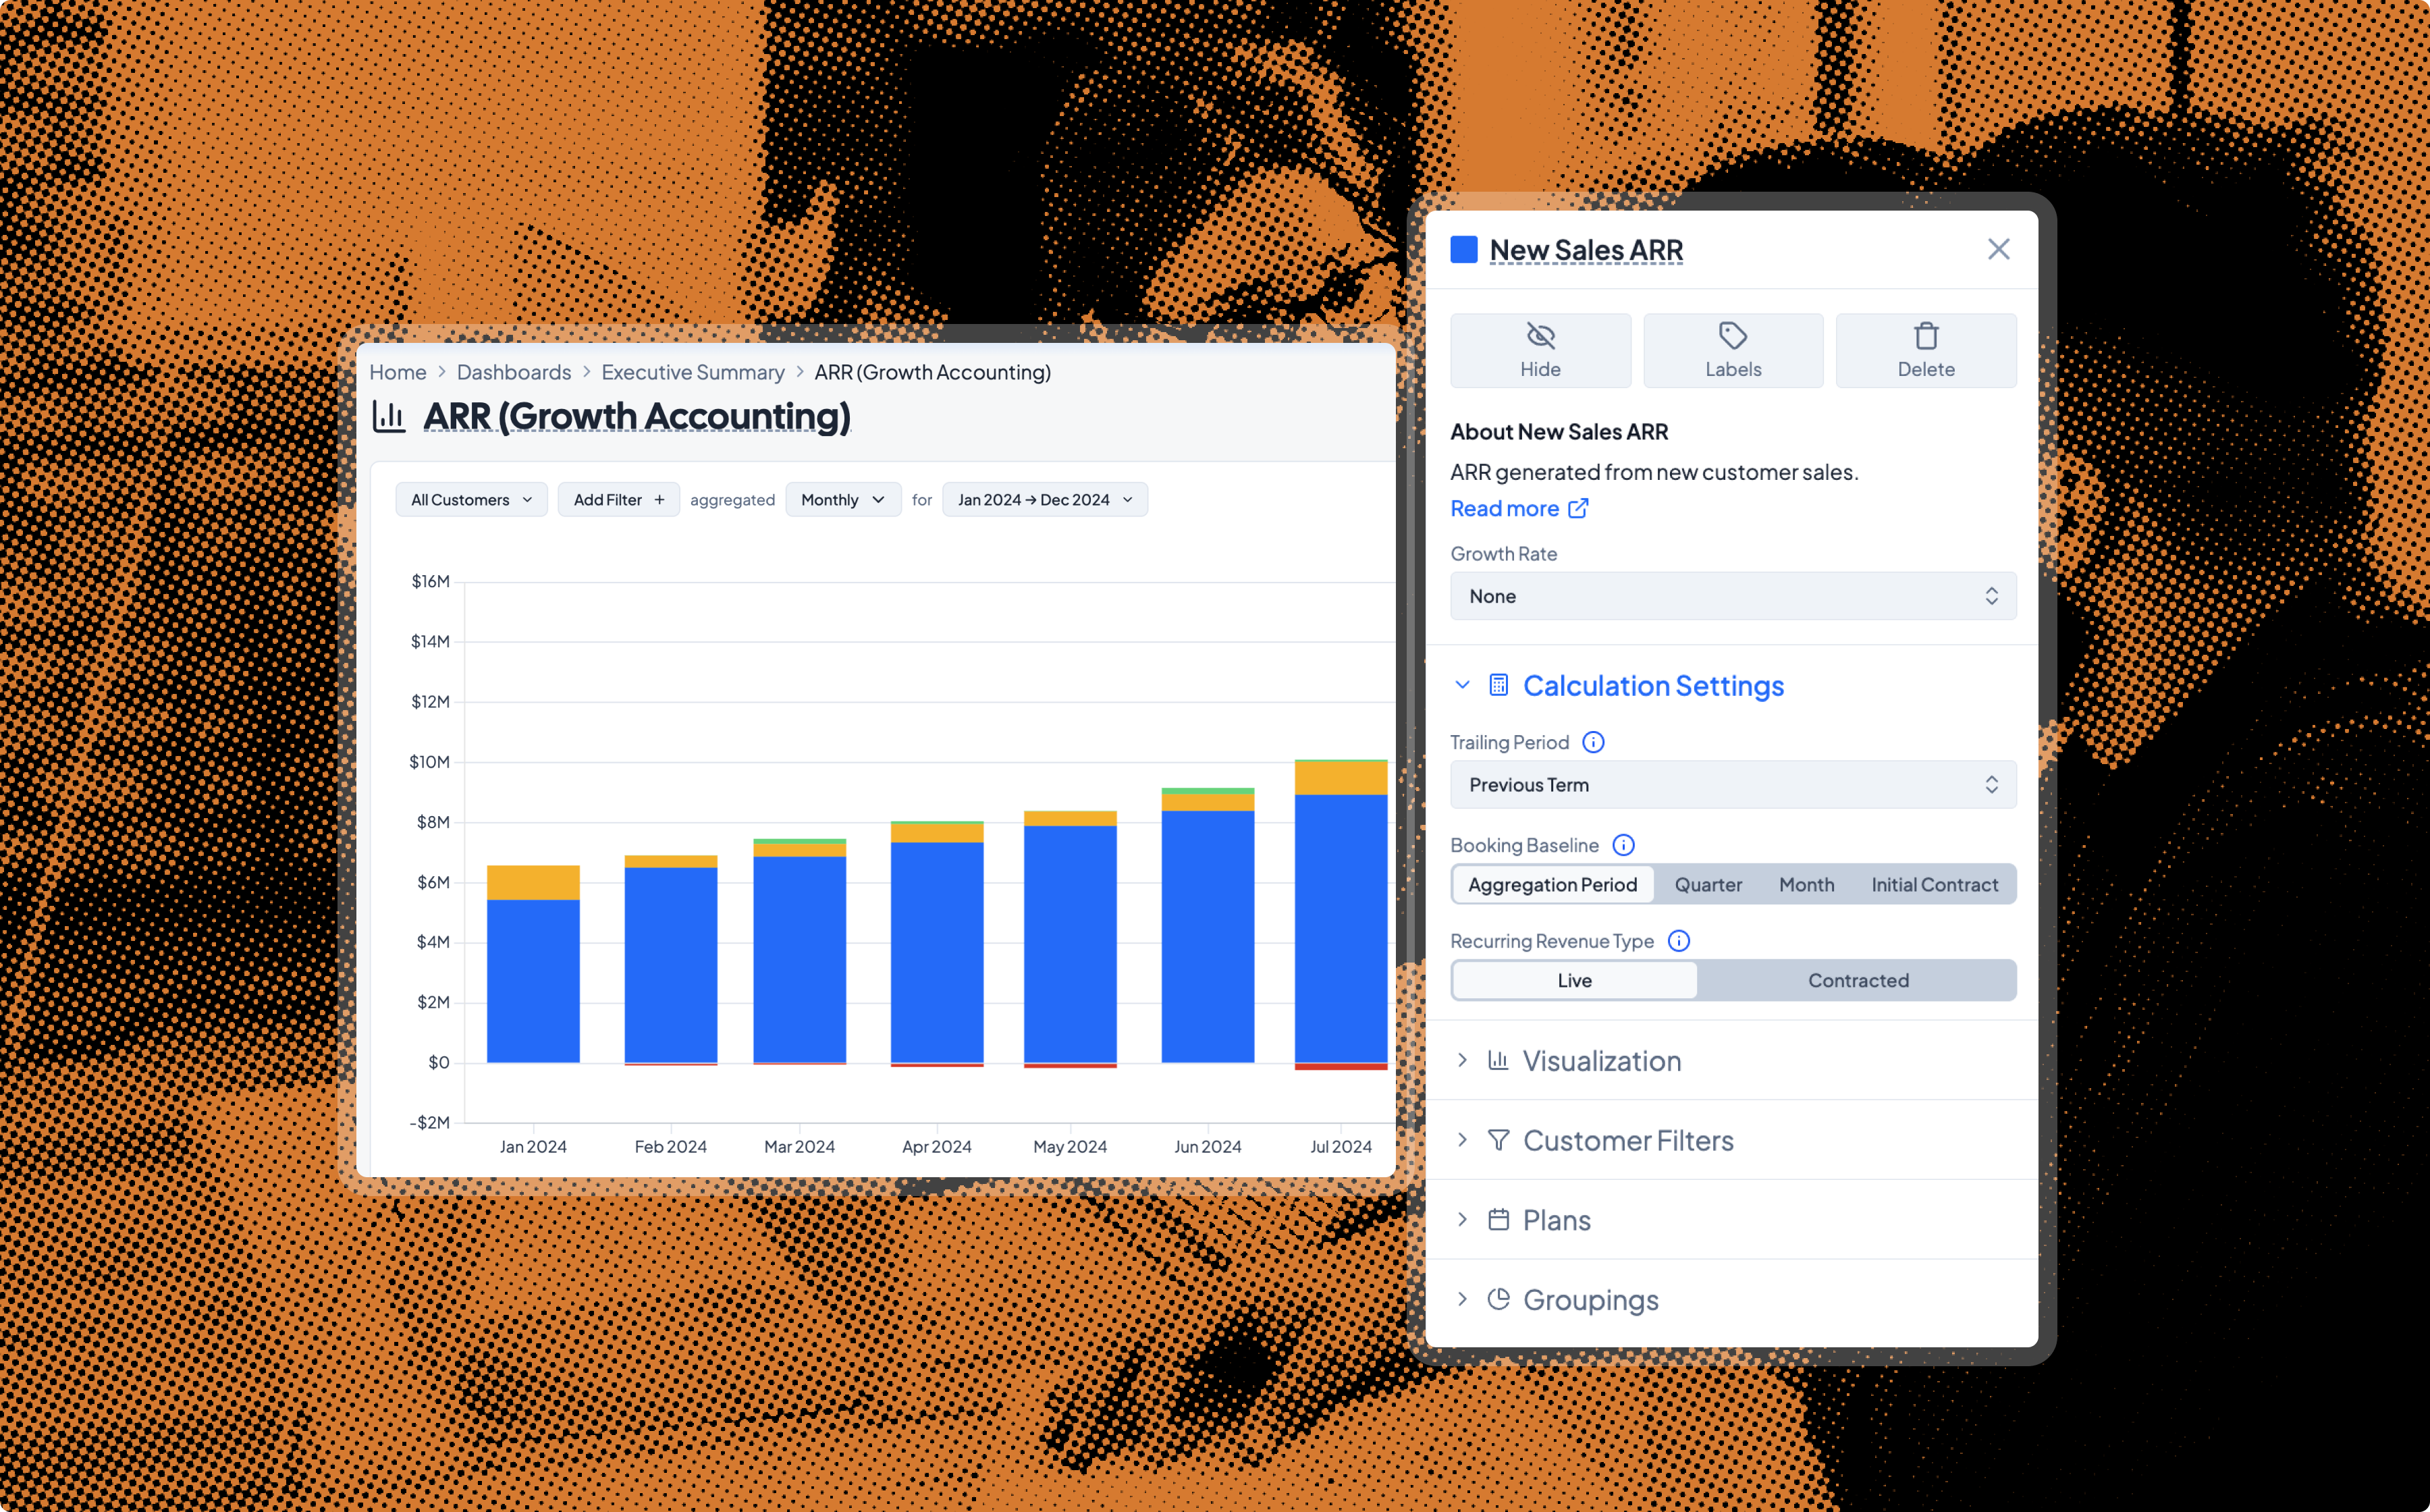
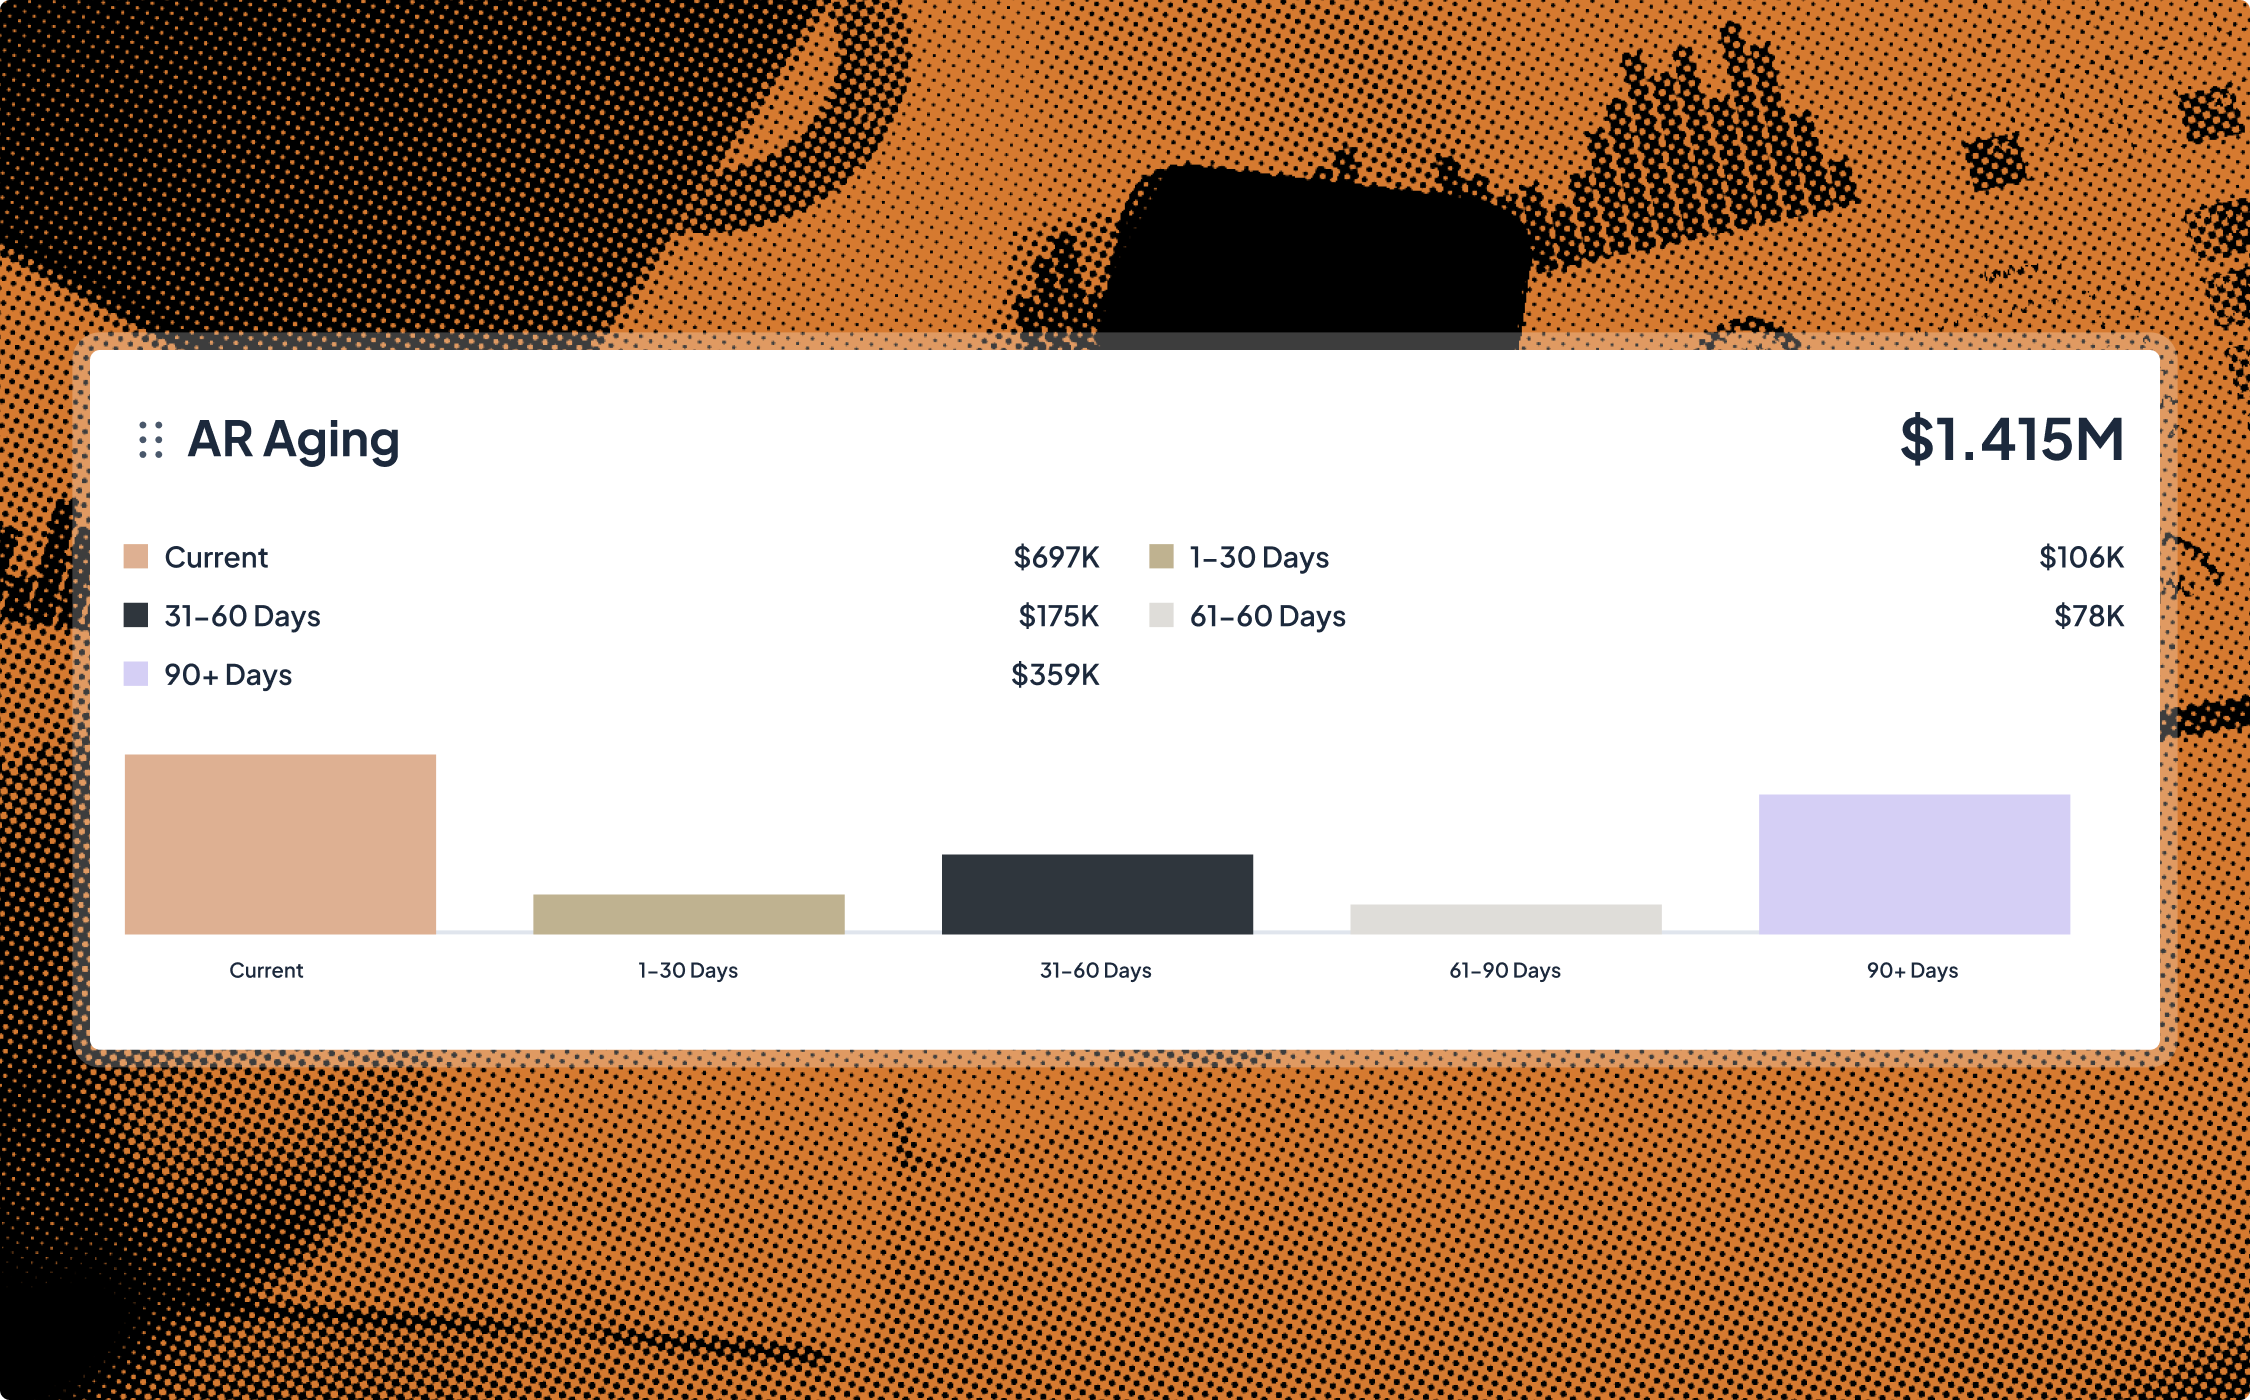
Track win rates, renewals, and cashflow trends to see around every corner.
Compare every KPI to your annual plan with confidence by syncing your operating model directly into Grid. Automate budget-to-actuals reporting and use pipeline and cashflow metrics to forecast with precision.
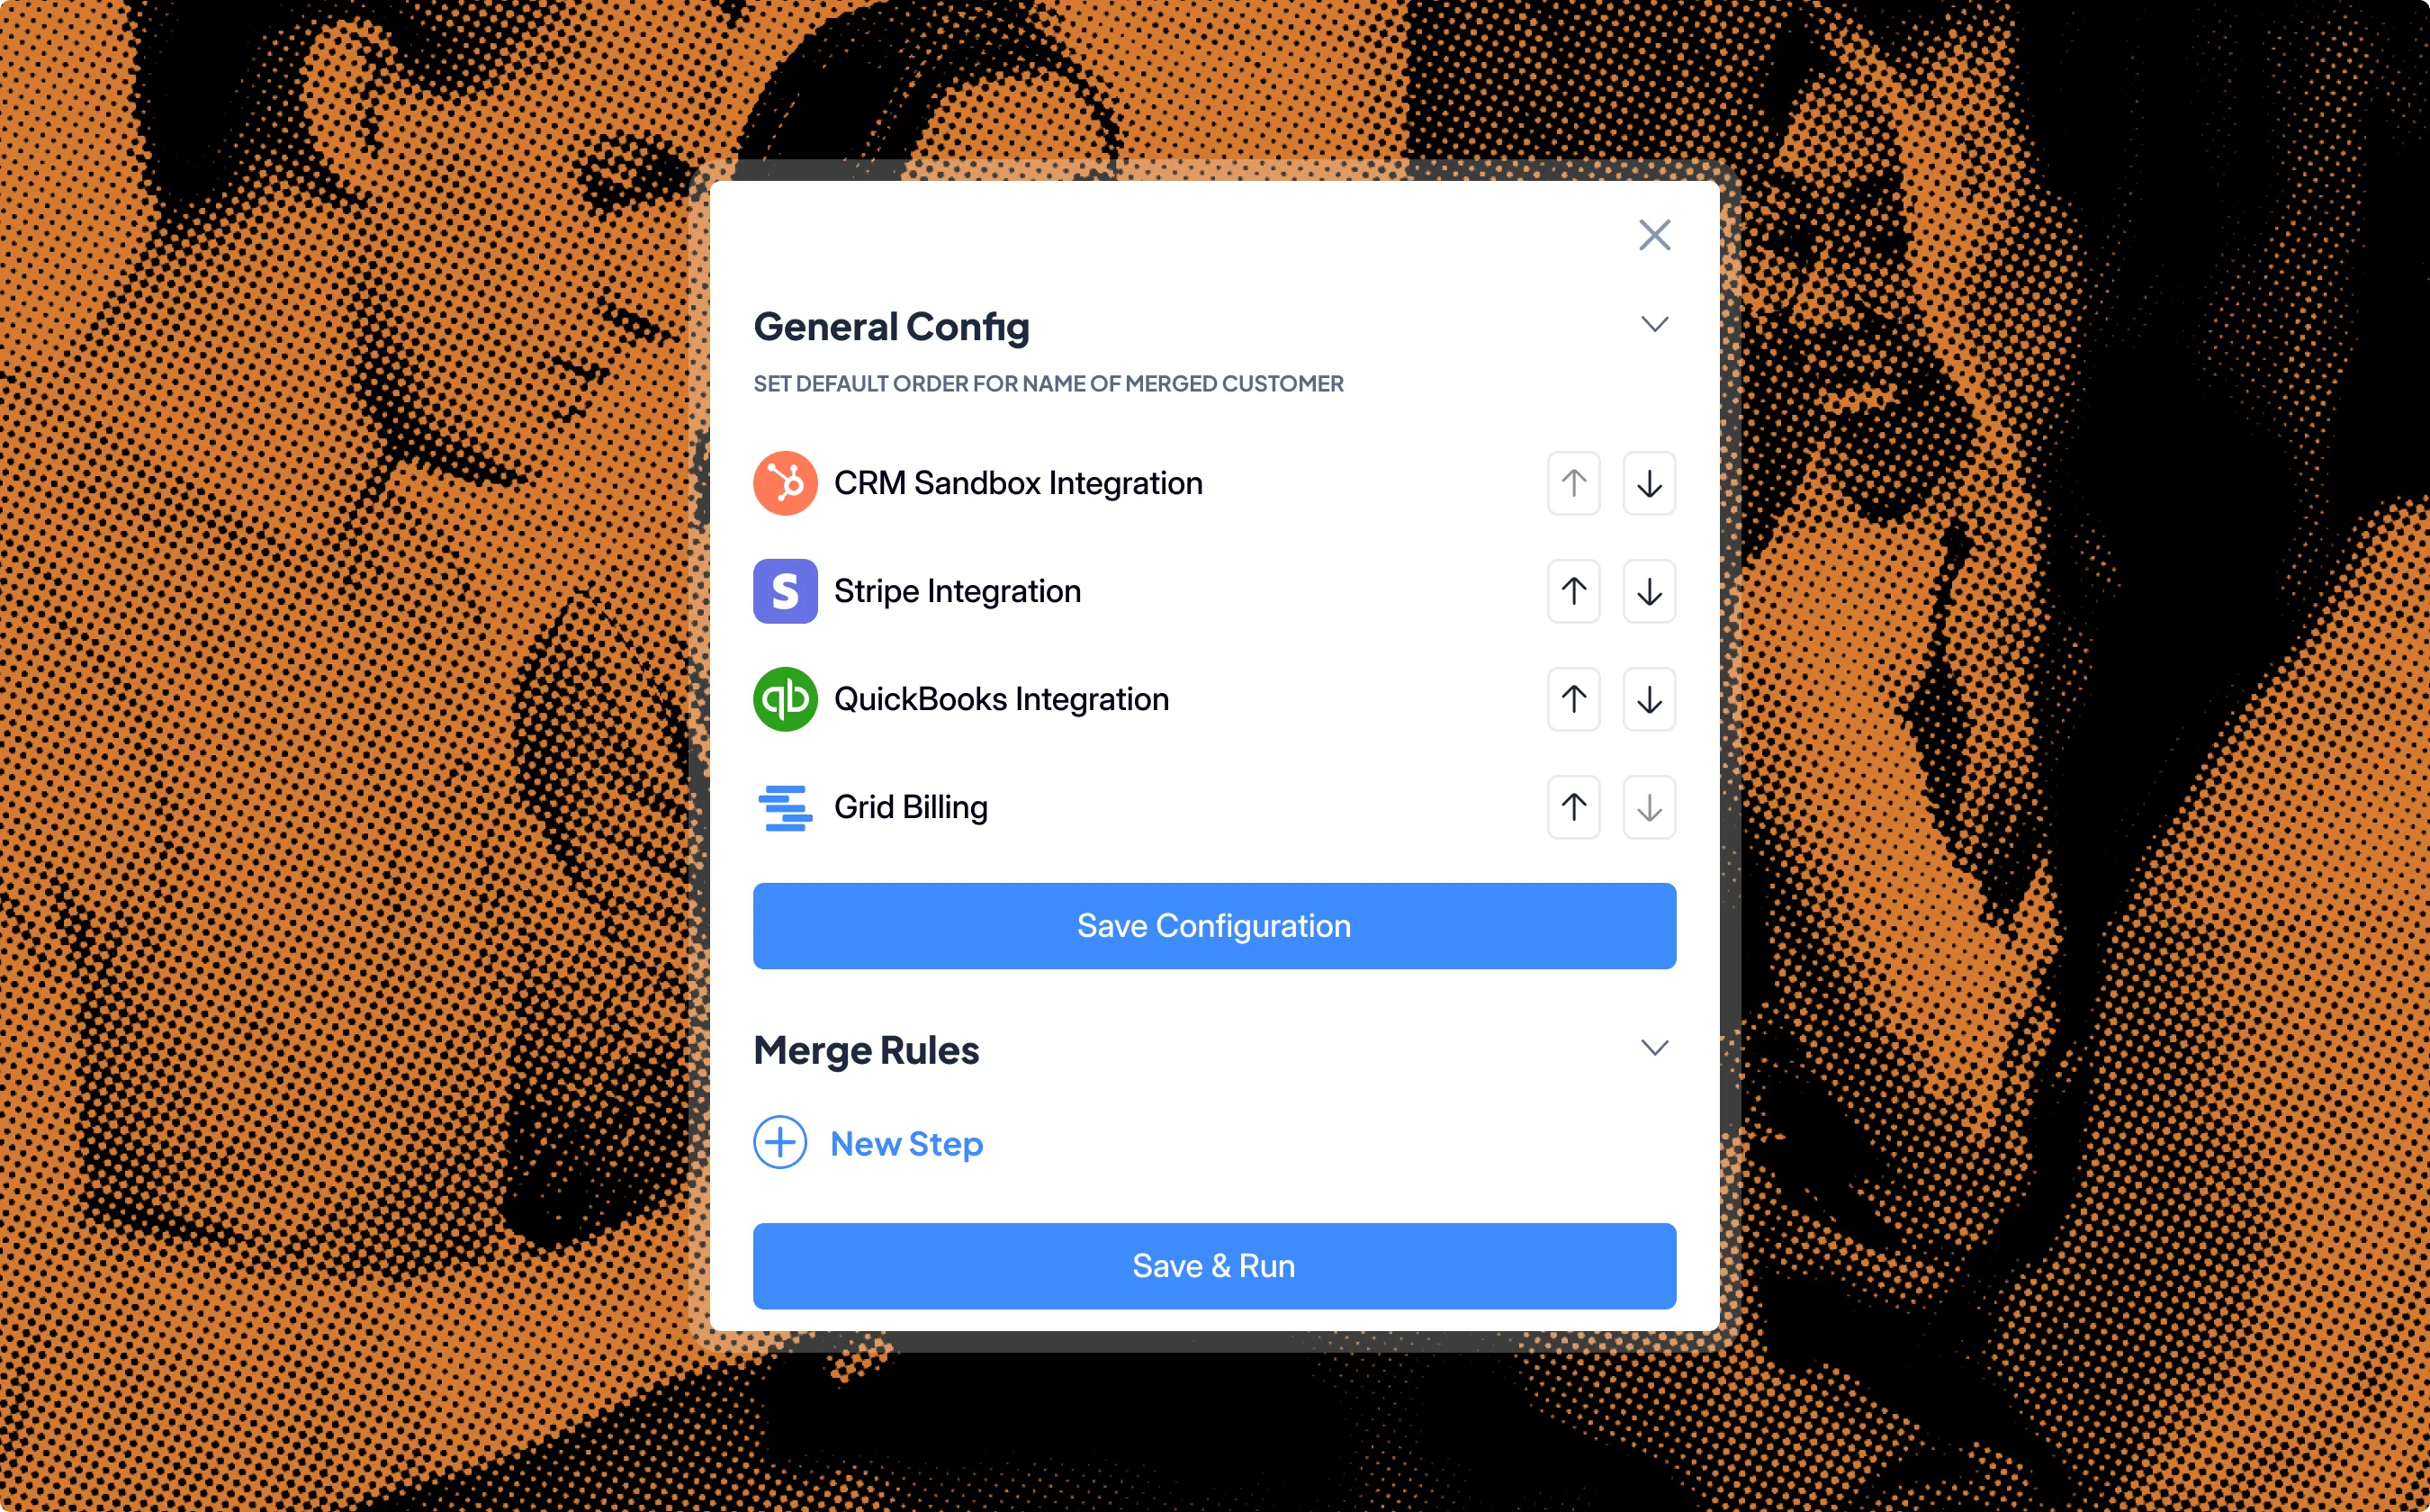
Merge customer data from your CRM and accounting systems into a single, accurate view. Segment across sources and automate reconciliation so reporting stays consistent, current, and trustworthy.
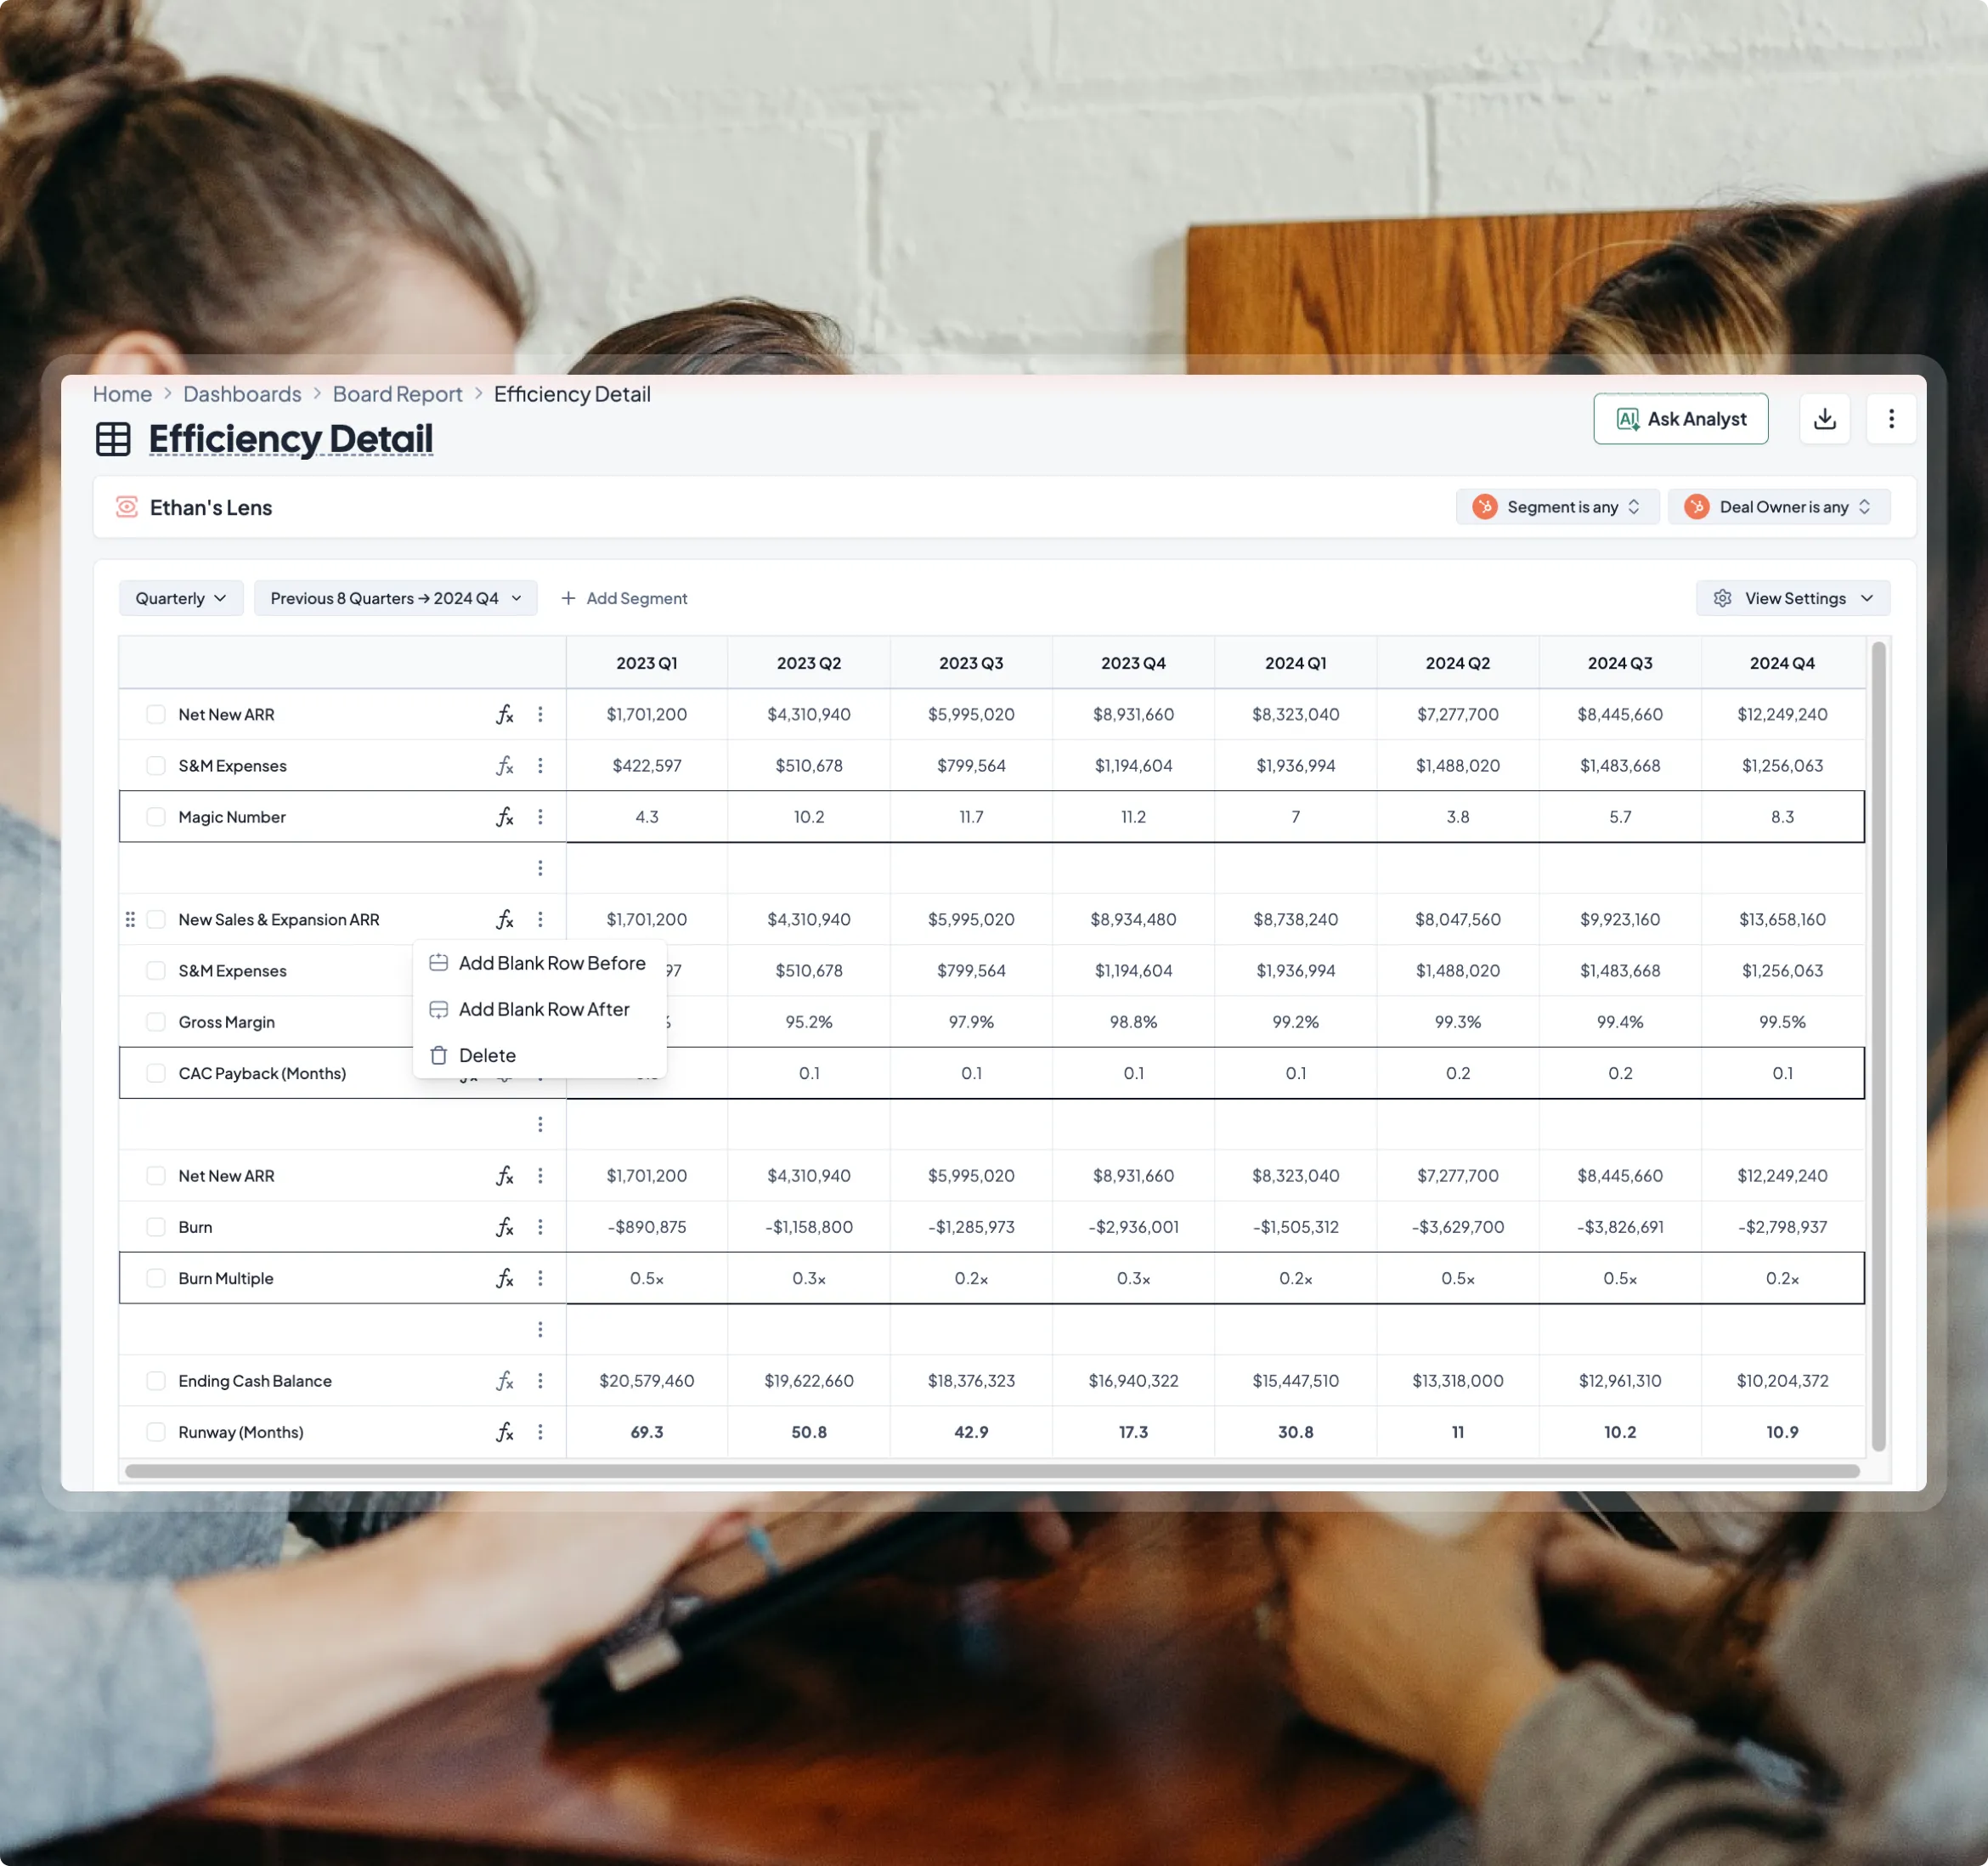

Every metric, broken down any way you need. Instantly.
Choose from our library of 150+ metrics or define your own. Segment and transform your data instantly, guided by our AI Analyst.


How planning in Grid works
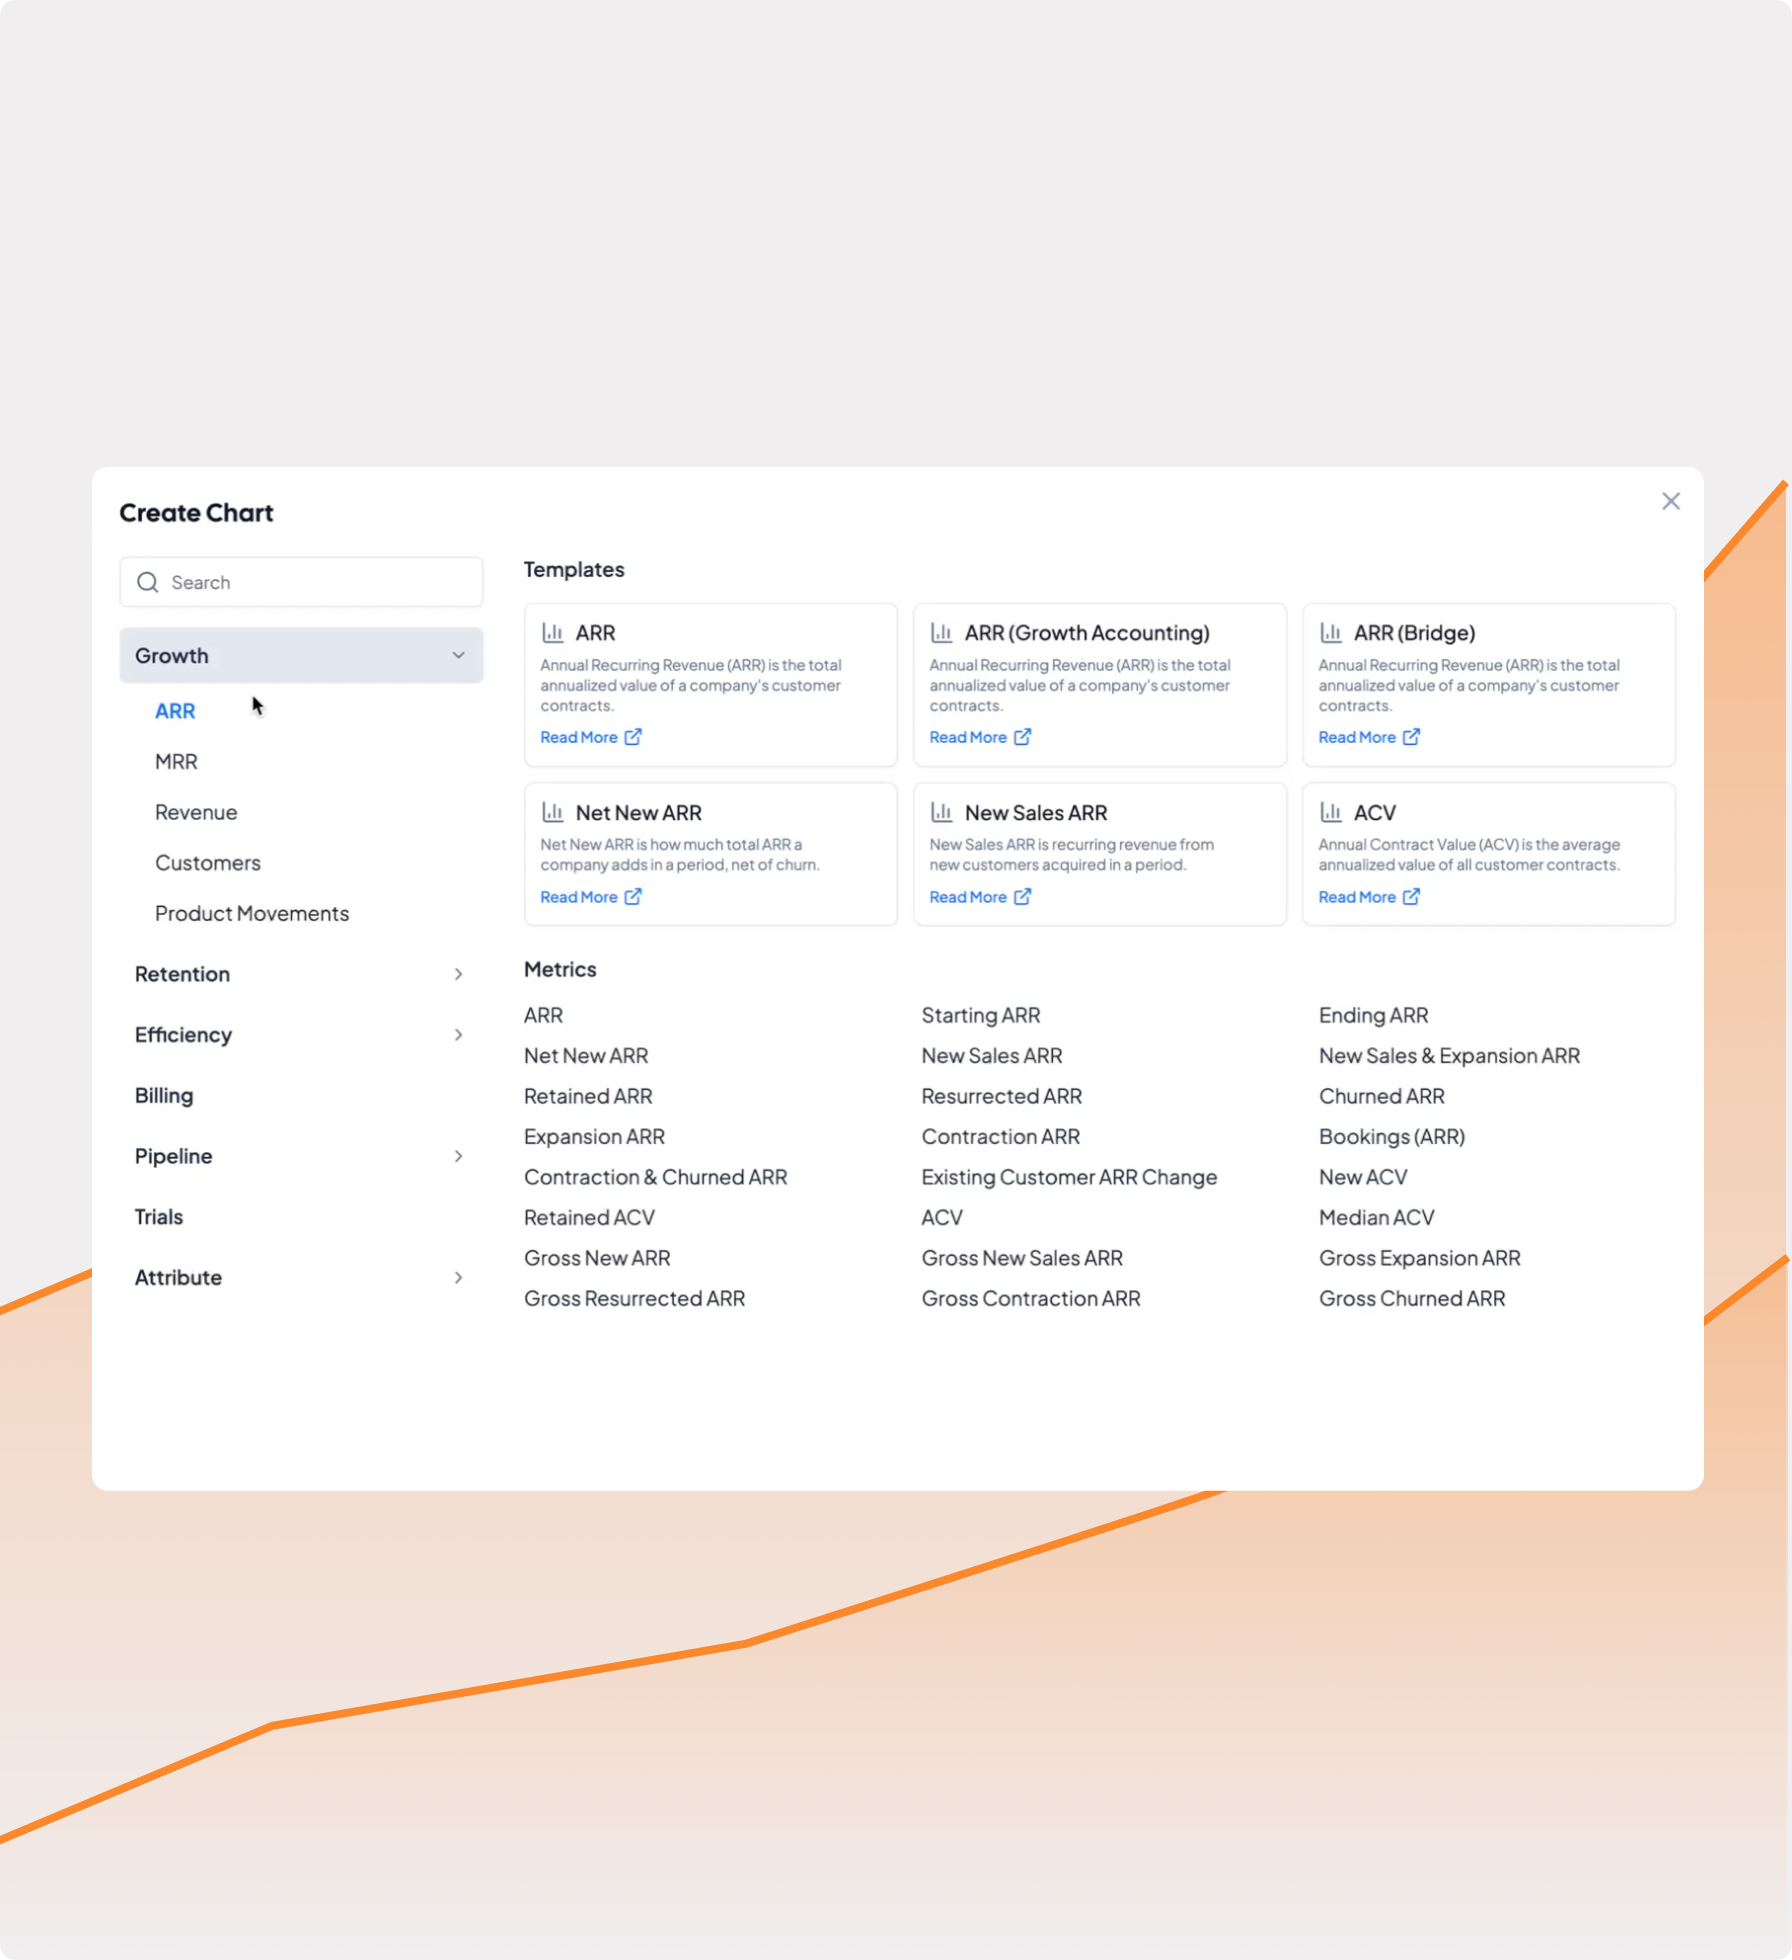
Mix-and-match between pre-built and fully customized metrics and charts.
Choose from our dashboard templates or select your own
Select from our library of over 150 pre-built metrics
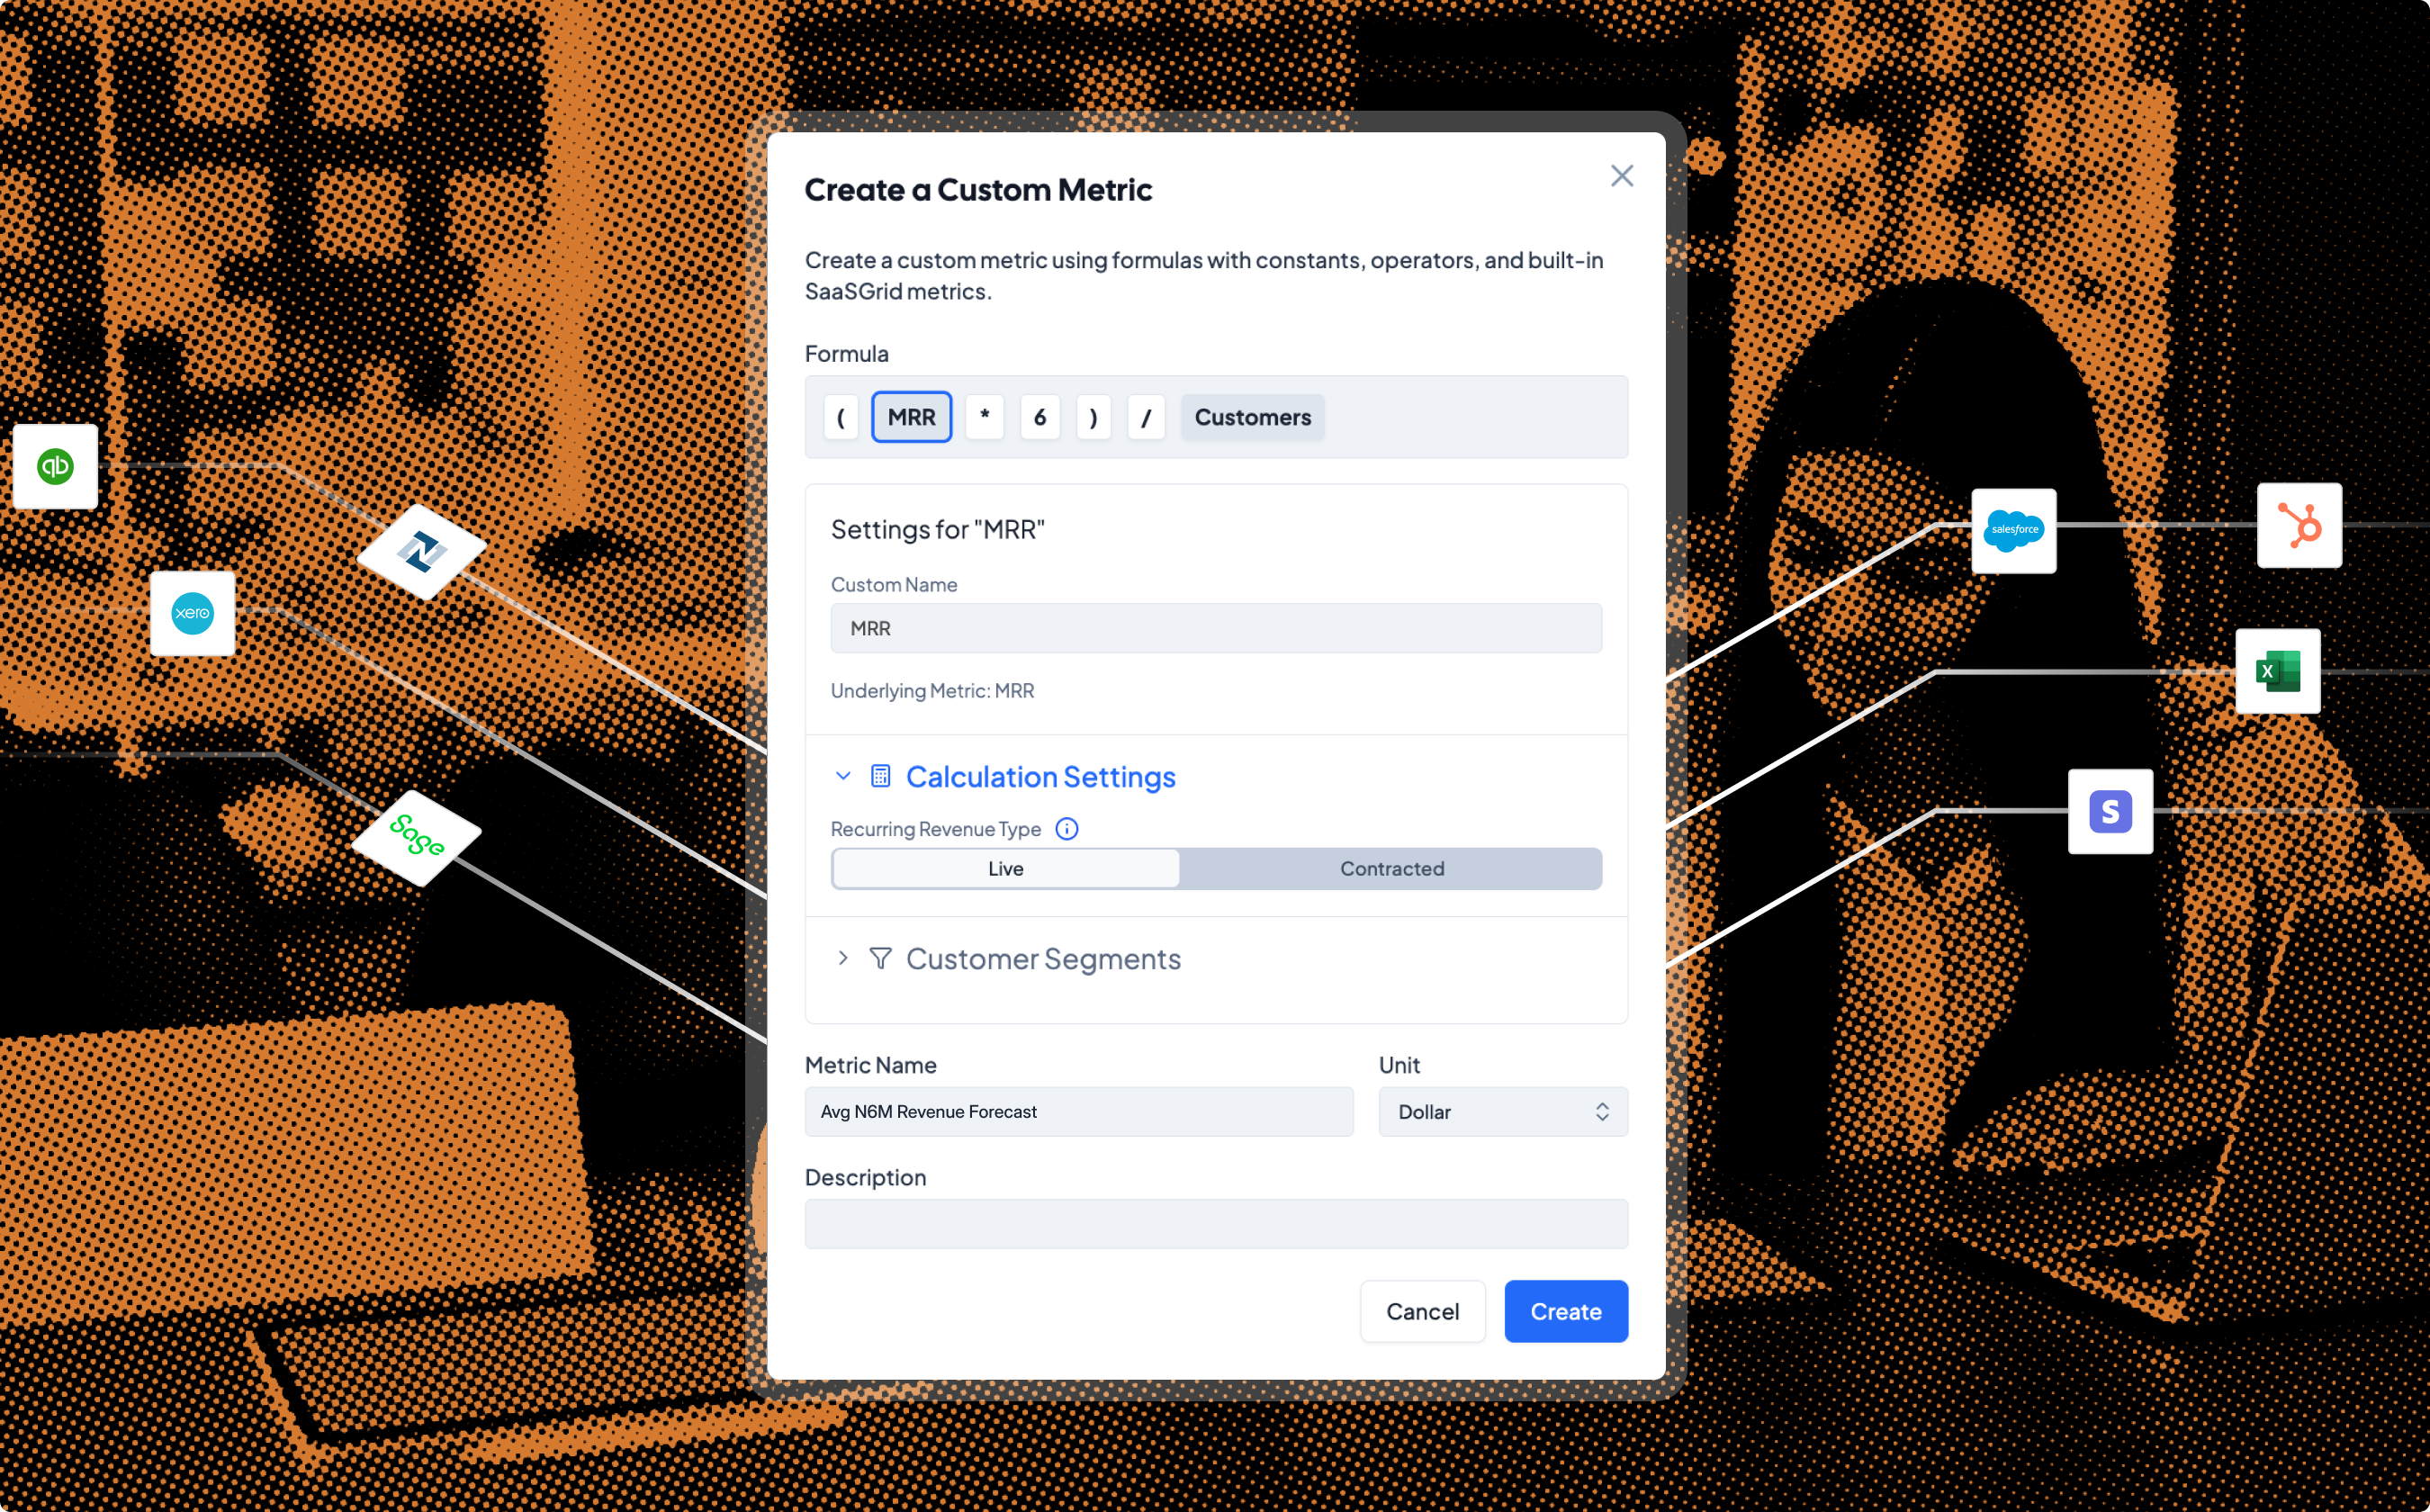
Define your own metrics to suit your company's needs
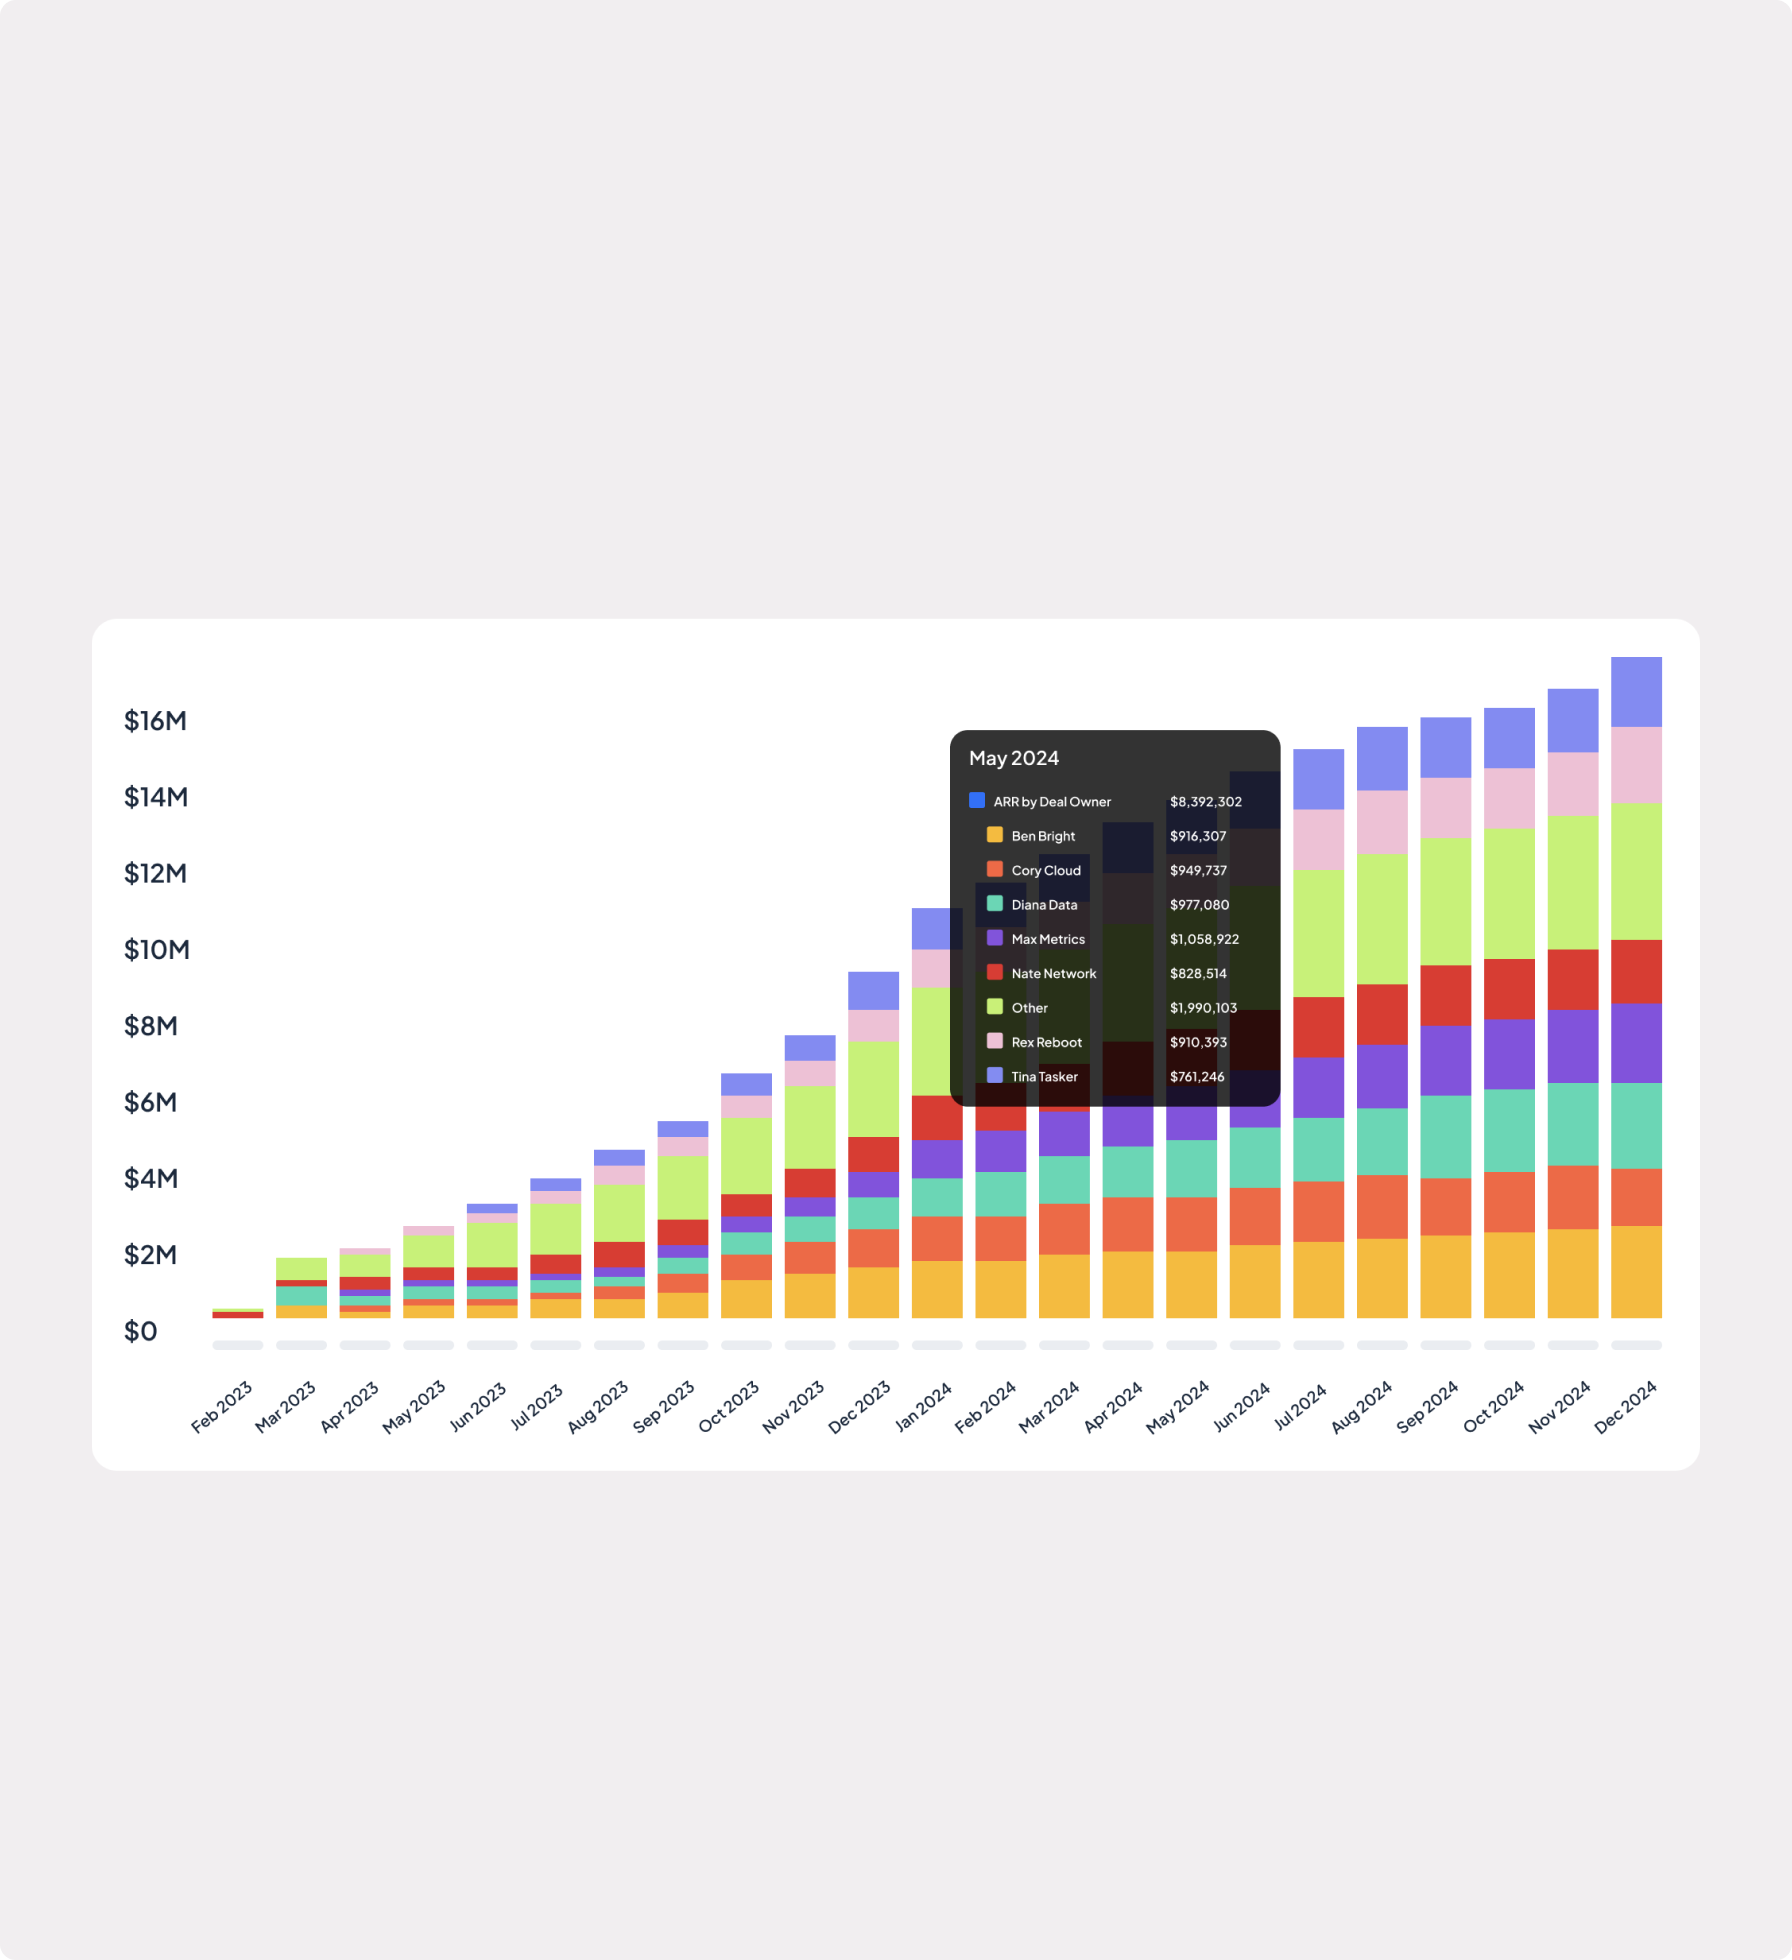
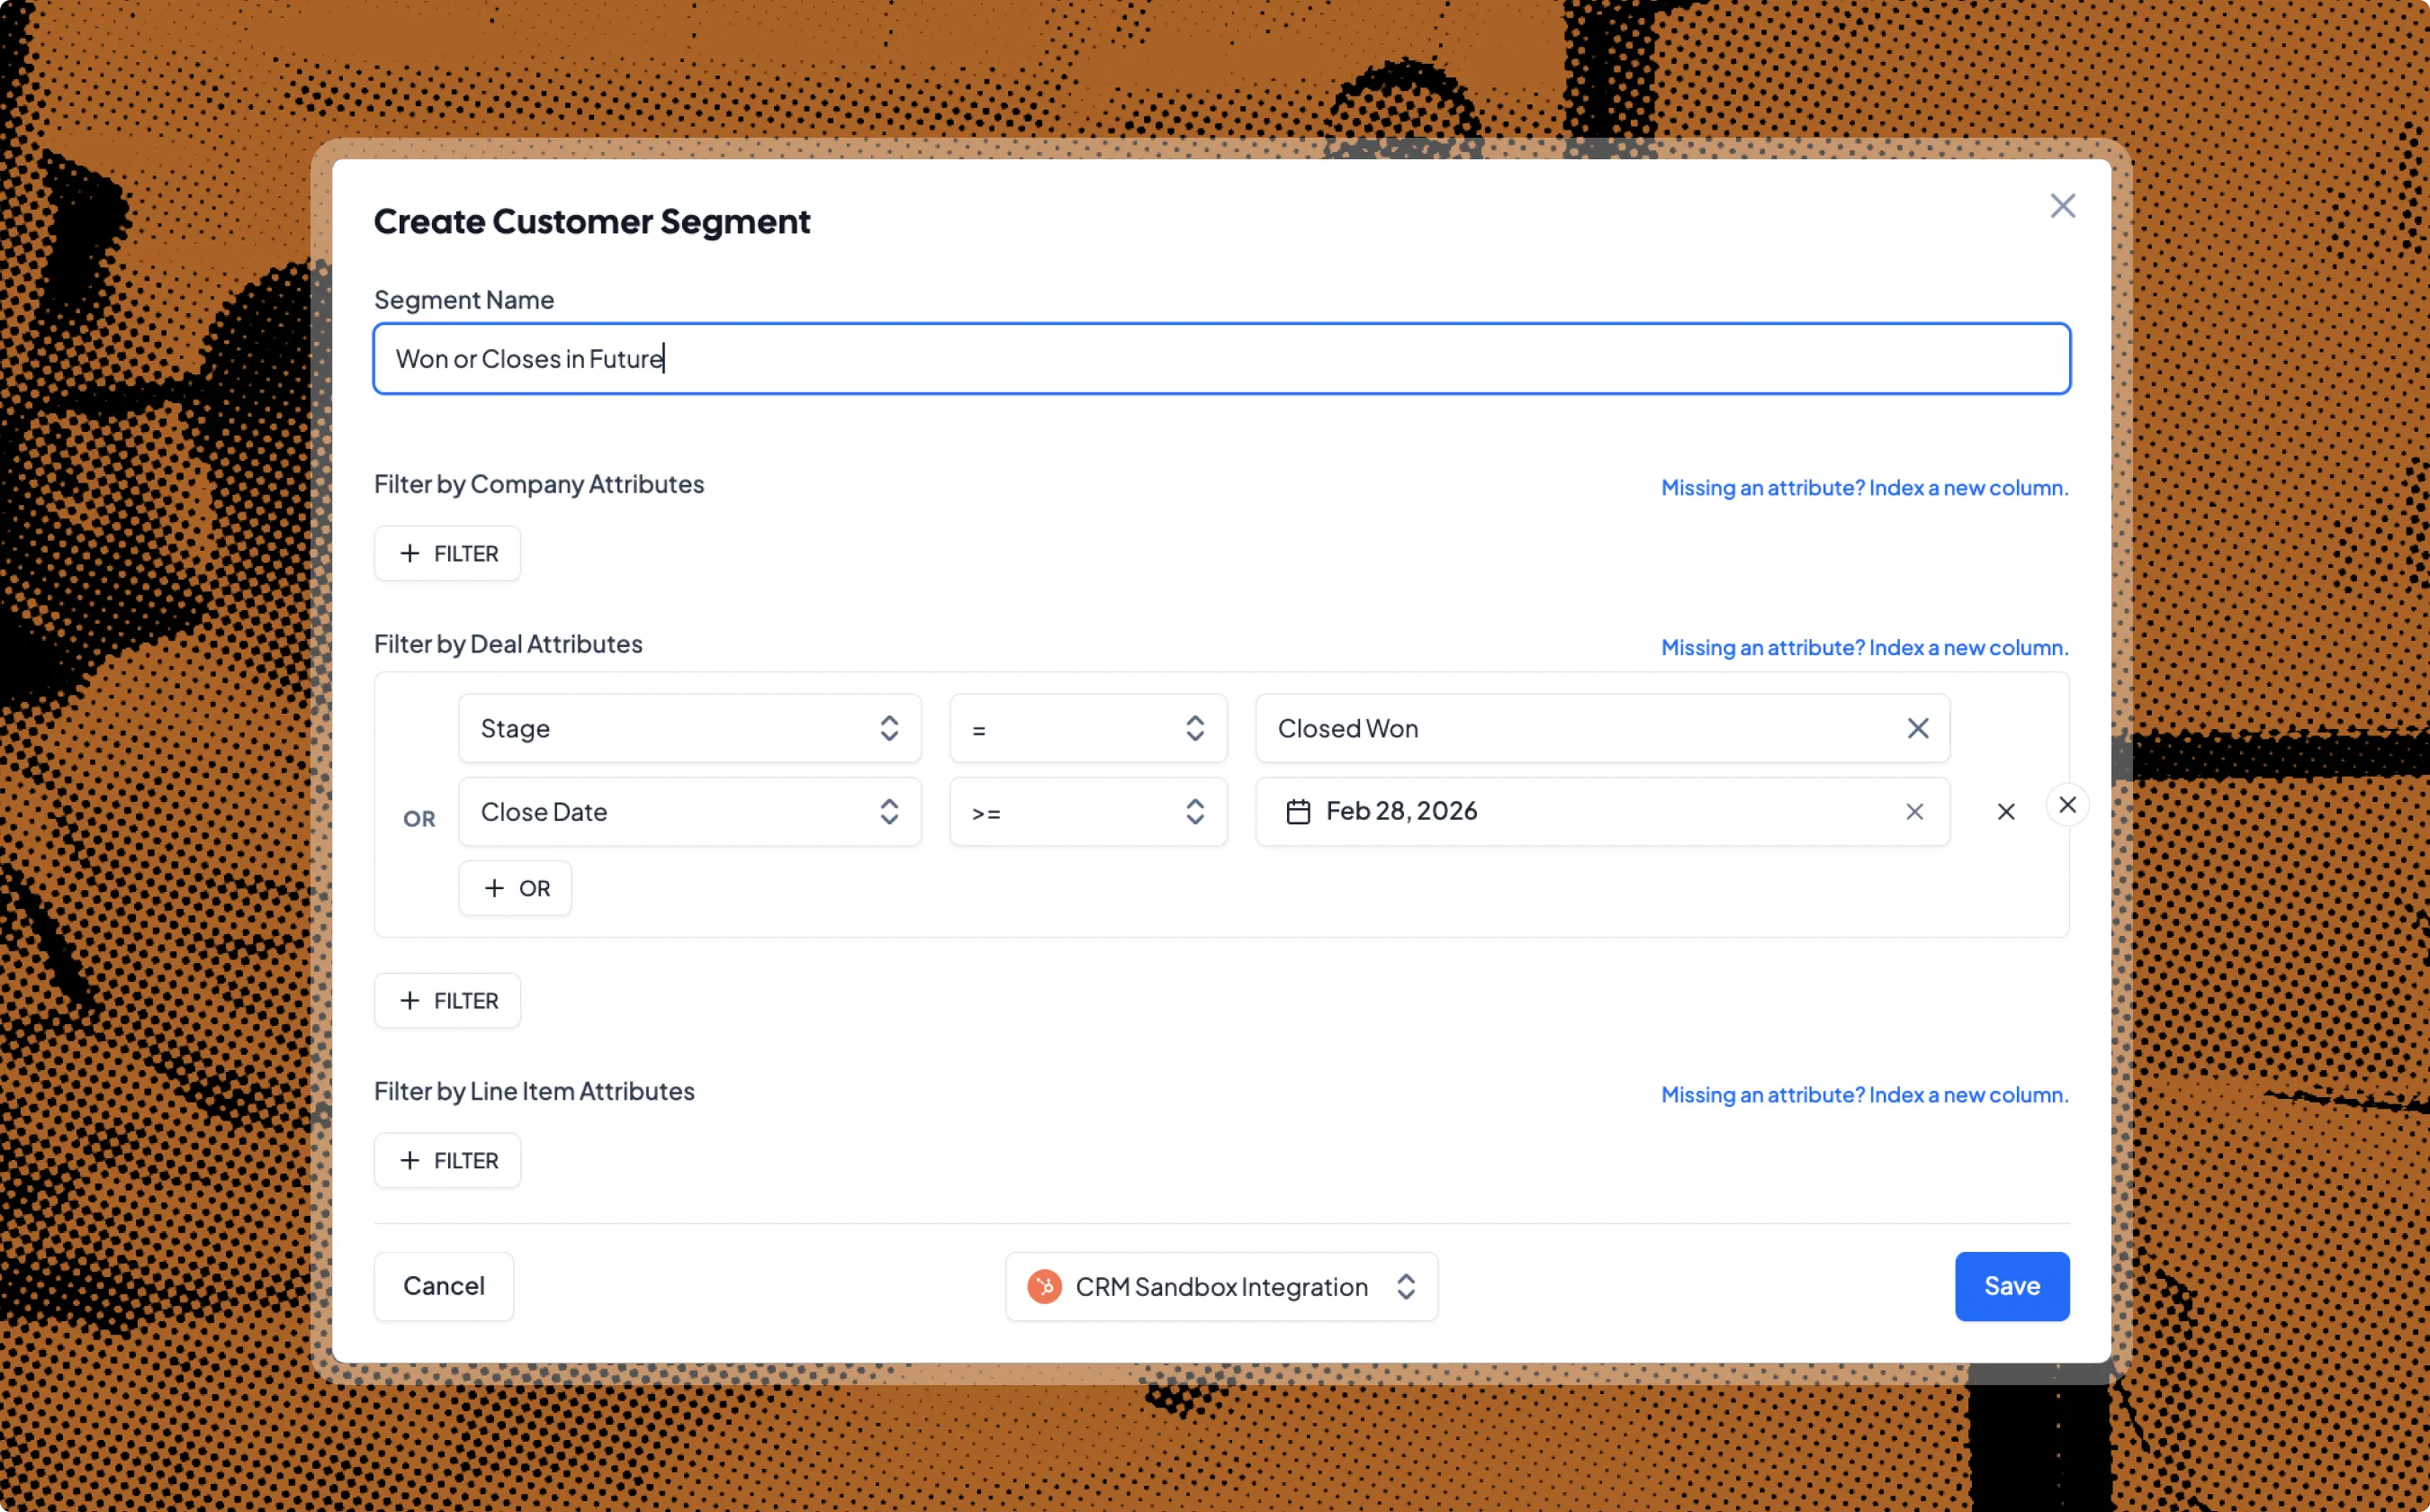
Transform, segment, and group your data to answer new questions without rebuilding analysis.
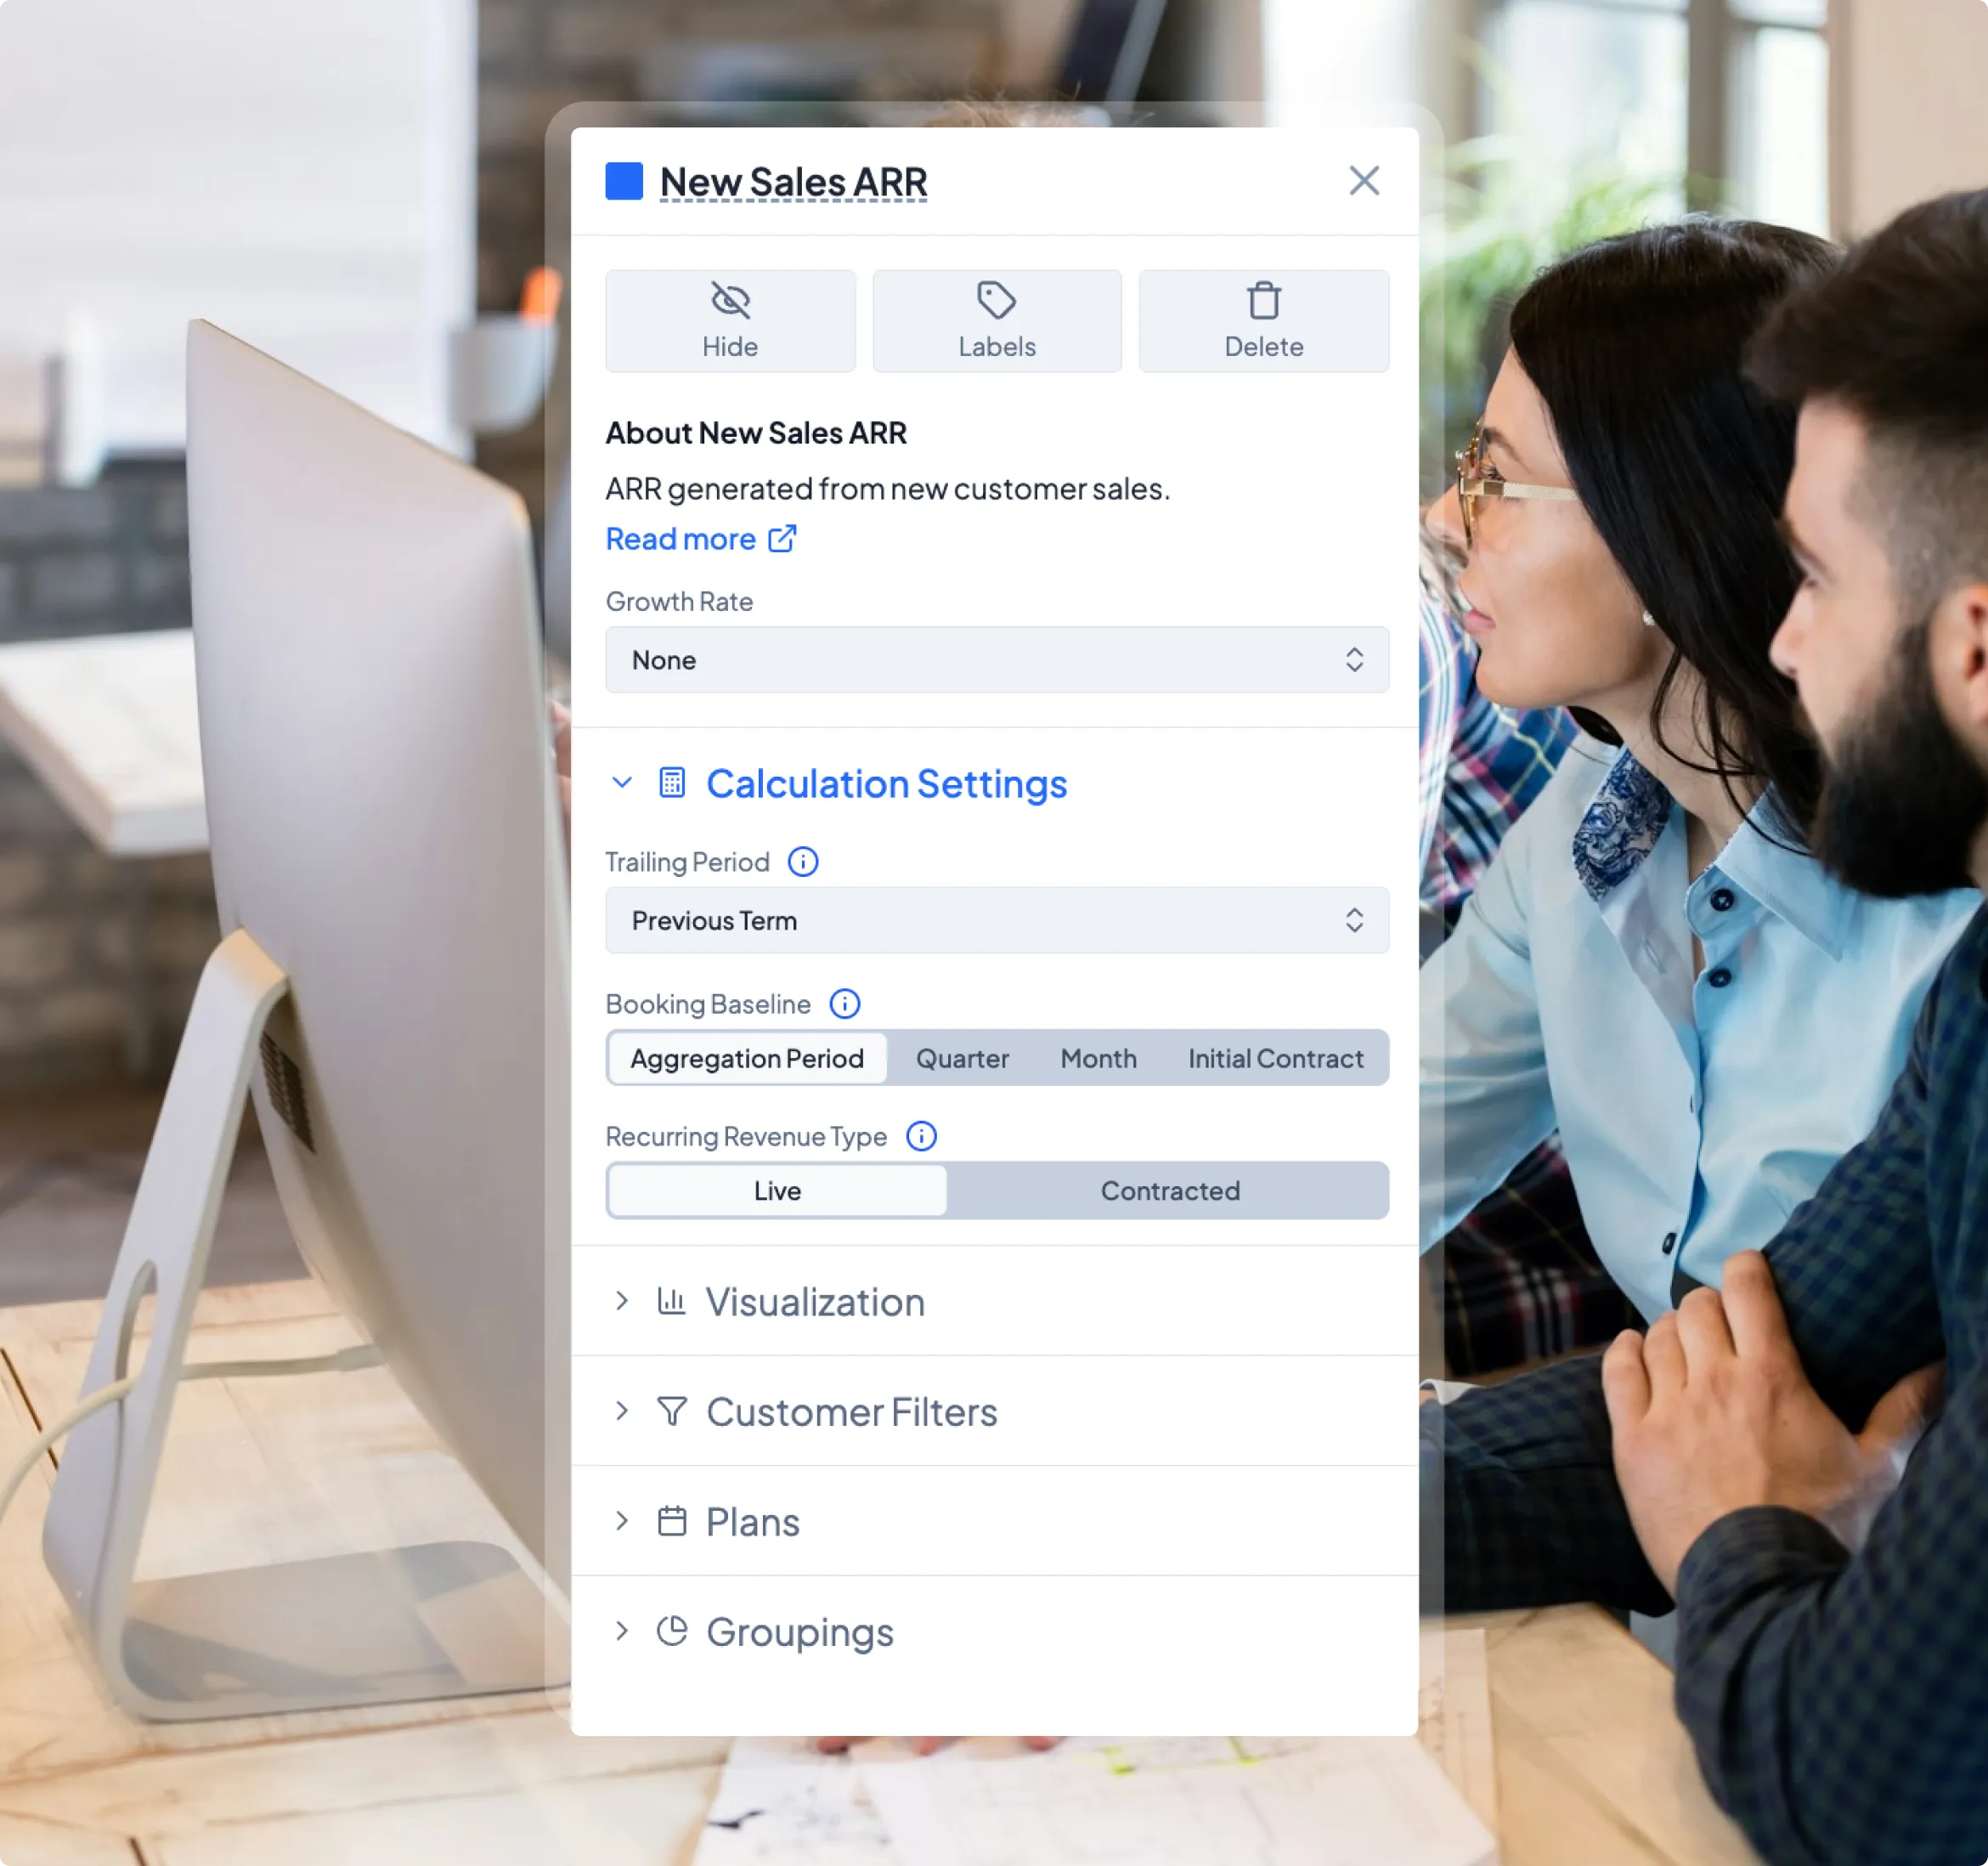
Transform financial data instantly using chart settings
Utilize our Segment builder to define customer and product segments
Group data to break down any metric by its attributes
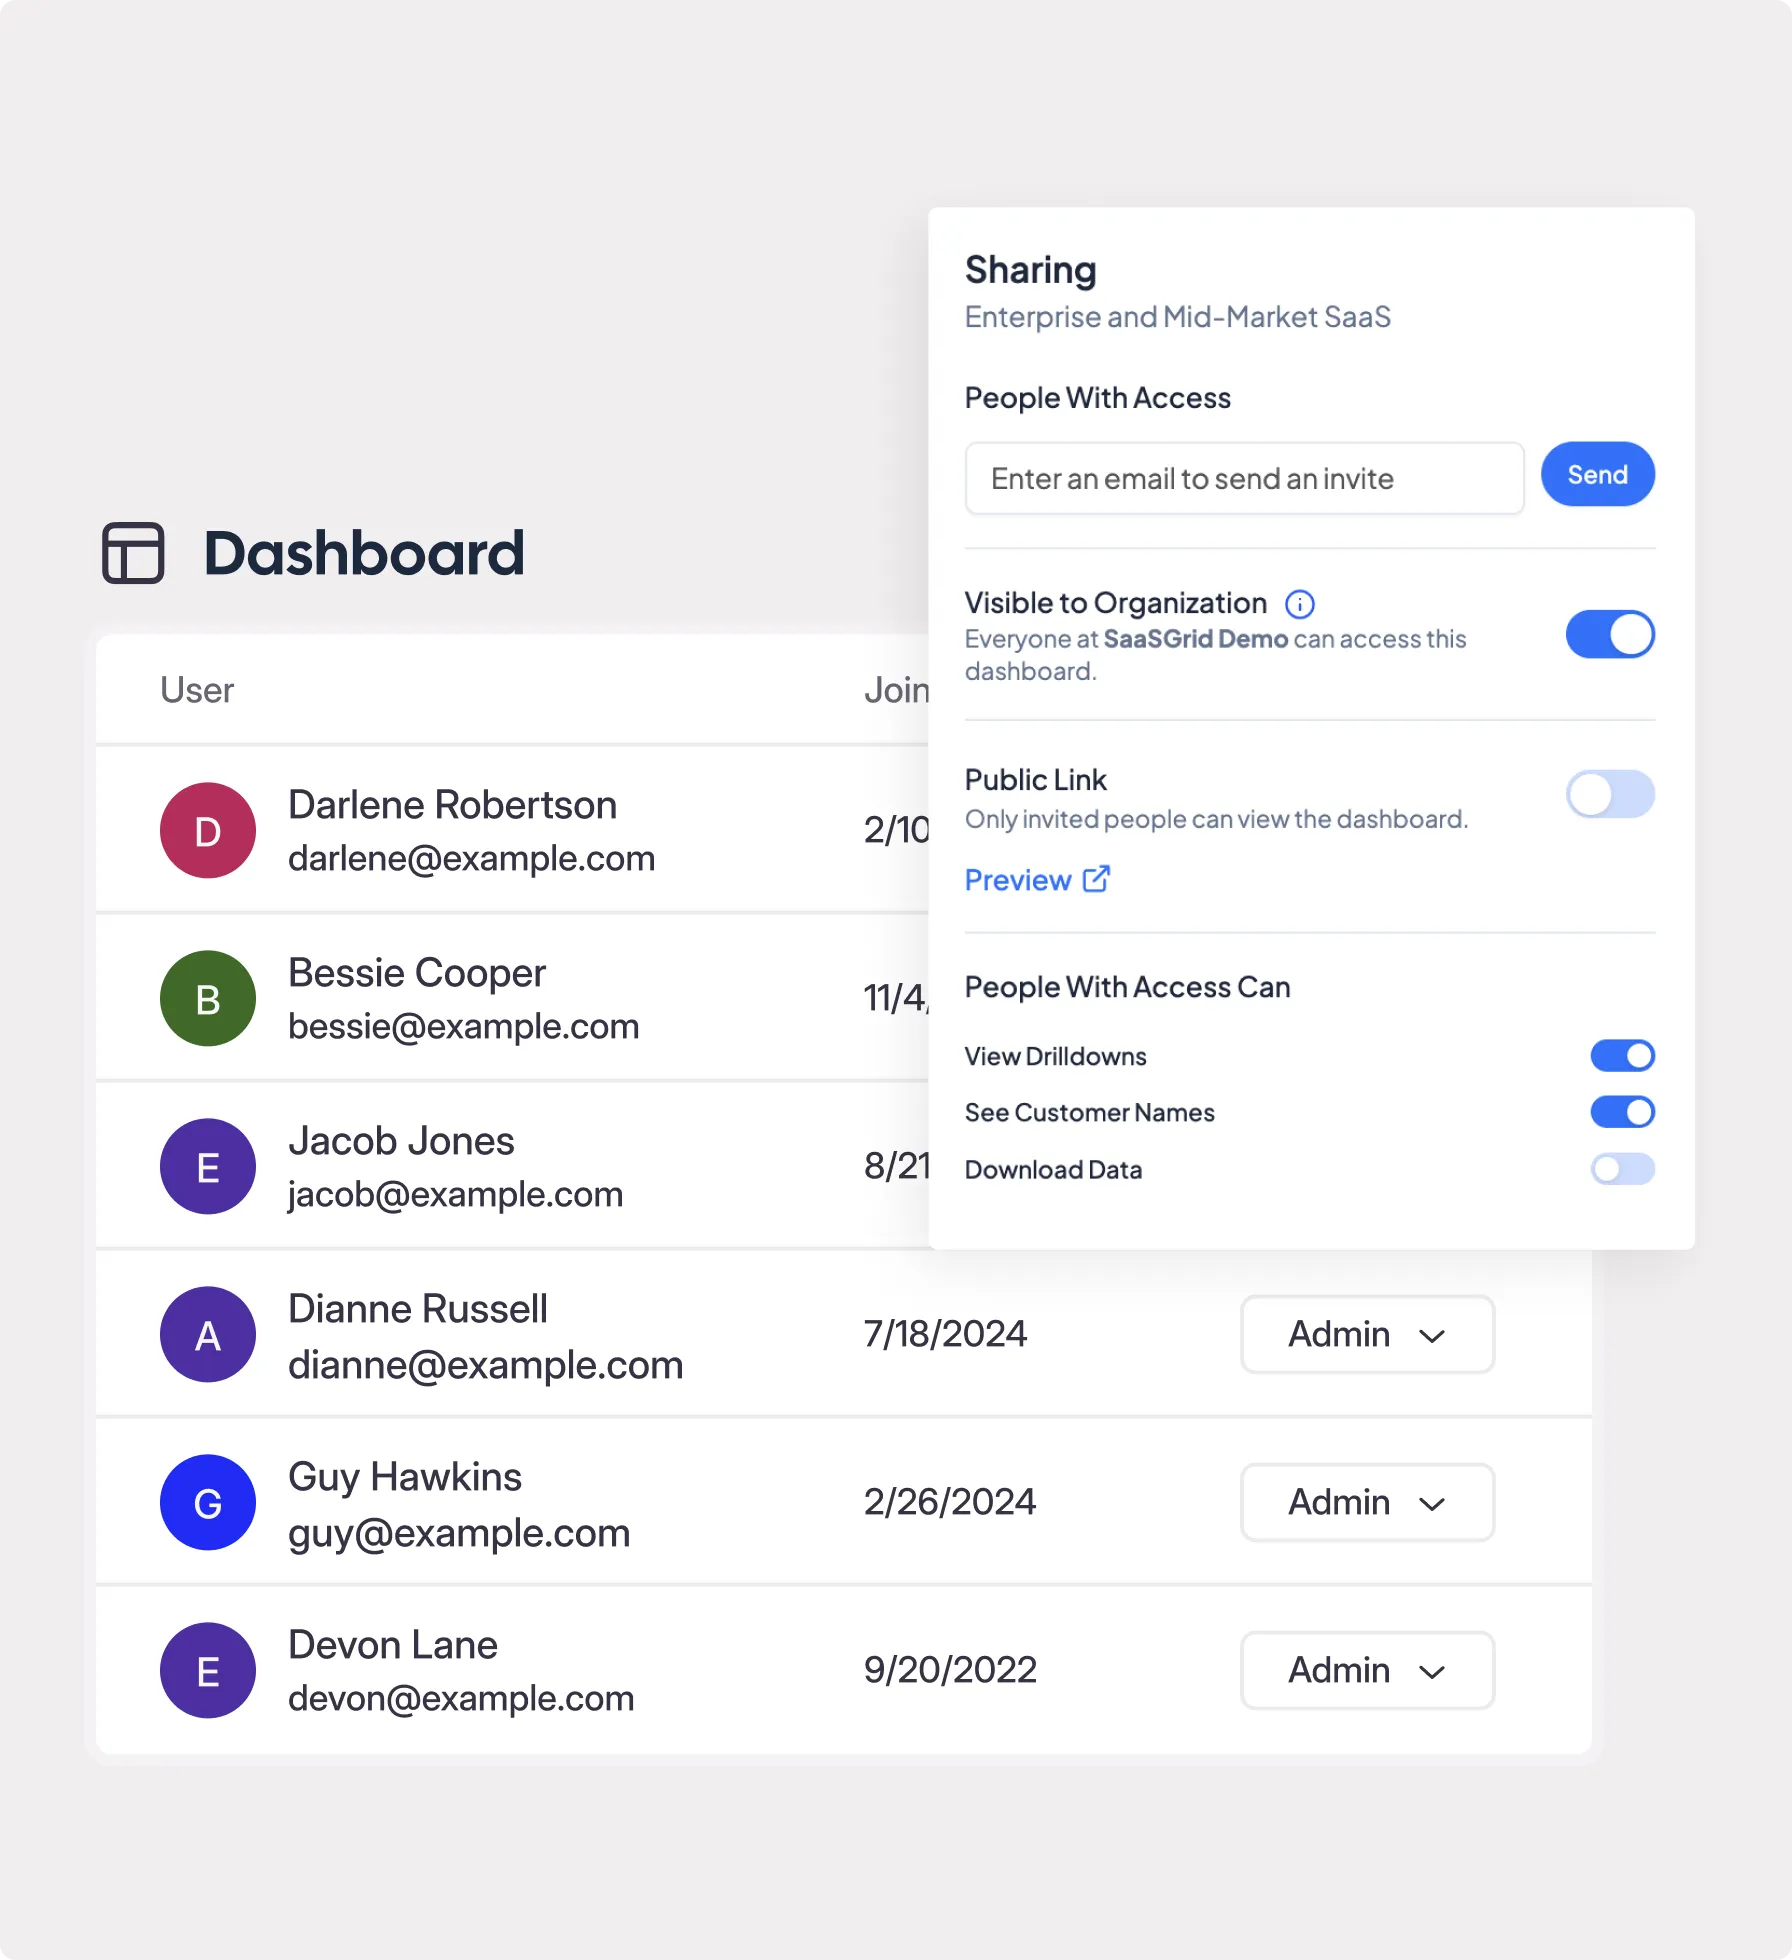
Give stakeholders self-serve access to insights and respond to questions instantly without becoming the bottleneck.
Share dashboards with specific users
Allow end-users to do their own data-filtering within your limits.
Respond to data requests instantly
Trusted by finance and operations everywhere


“Before Grid, I spent hours manually reconciling data and building reports.
Now, the platform lets me pull insights quickly, freeing time to focus on higher impact activities that drive growth.”


“Reconciling financial data across Ops, Finance, and Sales used to be like pulling teeth.
Grid aligns it almost instantly and has become a critical tool for us, we would not operate without them.”
Standardized metrics.
Confident analysis across the business.
By unifying data and definitions in one system, Grid enables faster analysis, consistent insights, and alignment across finance and GTM teams.
Without Grid Analysis
Analysis is fragmented and fragile. Data lives in disconnected tools, metrics change depending on the source, and teams rely on manual work just to explore basic questions, slowing insight and making deeper analysis harder as the business grows.
Data scattered across systems
Manual exports and spreadsheets
Inconsistent metric definitions
Stale data
Analysis gated by one person
With Grid Analysis
Analysis runs on a single, trusted system. Revenue data stays centralized, metrics remain consistent, and teams can slice, segment, and explore instantly so answers come faster and decisions are made with confidence.
Centralized, unified data
Instant segmenting and grouping
Consistent definitions everywhere
Fast, reliable dashboards
Shared visibility across teams
FAQ
How is Analysis different from standard reporting?
What kinds of questions can I answer with Grid Analysis?
Do I need SQL or spreadsheet formulas to use it?
Can I create custom metrics and segments?
How does forecasting work?
Can teams explore data without breaking the logic?
How does Grid eliminate spreadsheet bottlenecks?
