

From pipeline to payment, see how your business can run on Grid.
Bring together CRM, billing, accounting, and spreadsheet-based business data in one platform to track key metrics, automate reporting, run billing workflows, and see the full picture of how the business is performing.
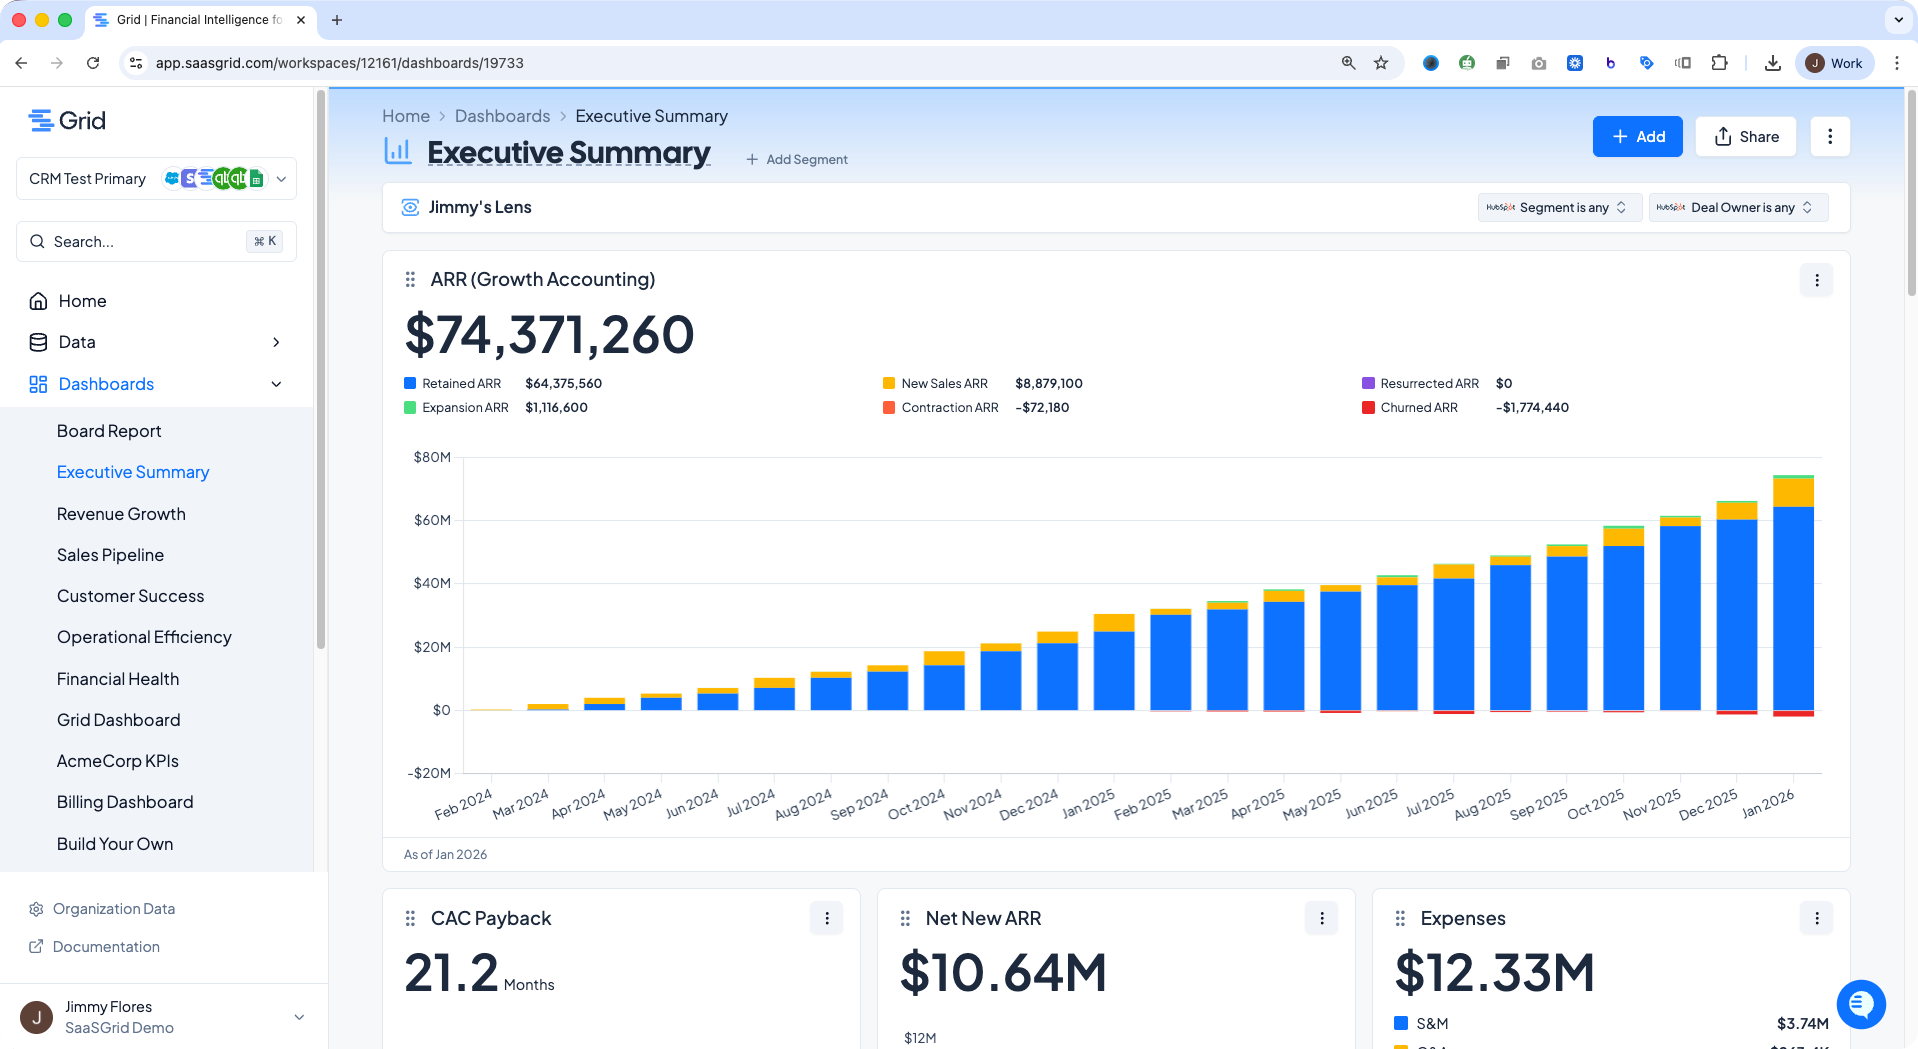
- See how Grid unifies revenue, pipeline, retention, and efficiency metrics
- Learn how to layer in operational data that lives outside your core systems
- Walk through real reporting workflows and get your questions answered live
What we’ll cover
in this live webinar.
A practical introduction to how Grid helps teams connect their data, standardize reporting, and make faster decisions.
Connect all your business data in Grid
See how Grid brings together CRM, billing, accounting, and spreadsheet data so you can report from one system instead of stitching numbers together by hand. Grid is built to merge data across sources and give teams a broader view of the business.
Track the metrics that run the business
Learn how Grid helps teams monitor the core metrics behind growth, retention, pipeline, efficiency, billing, and budget vs. actuals, with the flexibility to break those numbers down by product, segment, owner, and more.
See the full workflow in action
Follow a live walkthrough of how teams use Grid from data mapping to dashboards, reporting, and billing workflows. We’ll show how teams use Grid to get board-ready reporting faster and make day-to-day decisions with the same source of truth.
Trusted by finance and operations everywhere


“Before Grid, I spent hours manually reconciling data and building reports.
Now, the platform lets me pull insights quickly, freeing time to focus on higher impact activities that drive growth.”


“Reconciling financial data across Ops, Finance, and Sales used to be like pulling teeth.
Grid aligns it almost instantly and has become a critical tool for us, we would not operate without them.”
