SaaSGrid is now Grid! Read about our evolution here.
Most finance and RevOps teams track CAC. Almost nobody tracks CPA, even though it's one of the most useful SaaS metrics worth tracking once you know where to look.
That gap is a problem. CAC tells you what you're spending across the whole business. It doesn't tell you which channel is quietly burning cash while another one prints money. CPA does.
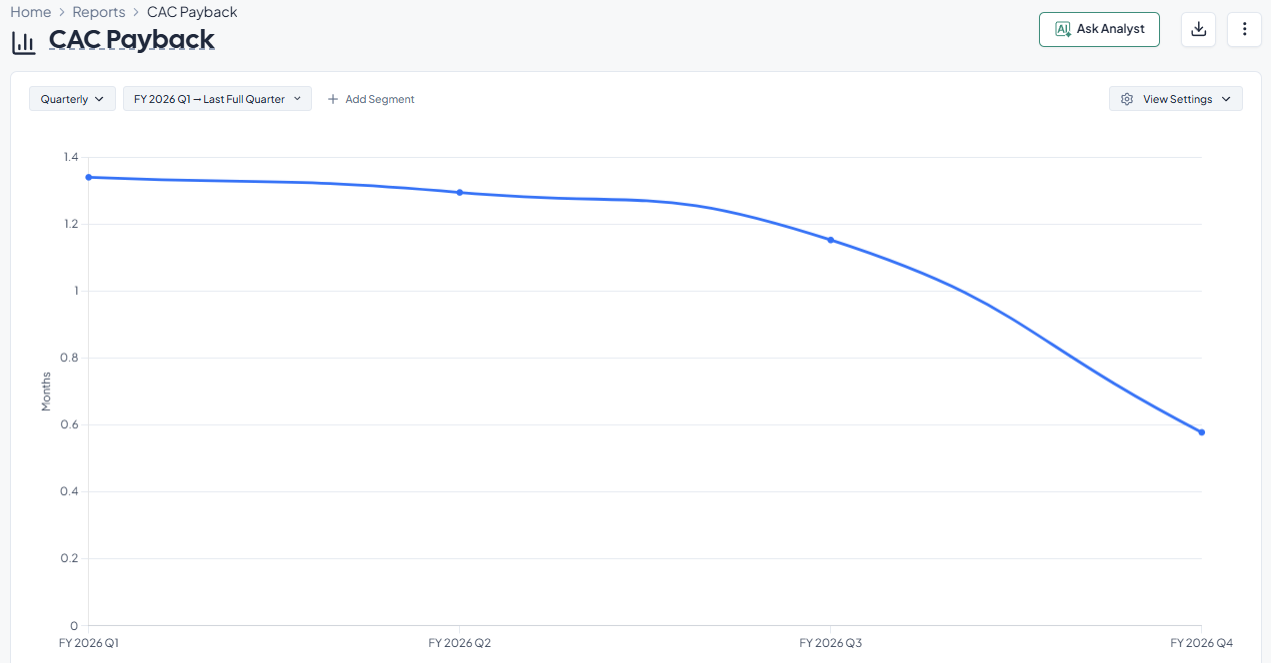
Cost Per Acquisition is the cost to acquire one customer through a specific campaign or channel. Not your blended average across every channel combined. One campaign, one channel, one number.
The formula is simple:
CPA = Total campaign spend ÷ New customers from that campaign
CAC and CPA aren't the same thing, even though people use them interchangeably.
CAC is your scoreboard. CPA is your diagnostic tool. You need both, but they answer different questions.
A healthy blended CAC can hide a channel that's bleeding money. If your paid social CPA is $4,000 and your organic CPA is $200, a blended CAC of $900 looks fine on paper. It just doesn't tell you to shut off paid social.
CPA is how you catch that before it costs you a quarter of budget, and it's a much clearer signal than waiting on pipeline data to eventually show the damage downstream.
CPA doesn't happen in one step. It builds up across your funnel, and each stage has its own cost. Here's a real example, walked through stage by stage.
Say you need 60 leads to close one deal. You spend $166 per lead on average. This is exactly the kind of breakdown RevOps teams end up rebuilding by hand every quarter unless it's tracked automatically.
By the time you reach a signed deal, that single customer cost you roughly $9,960. Break it down by stage and you can see exactly where the money goes, and exactly which stage to fix first if the number gets too high.
A CPA number means nothing on its own. It only means something next to what that customer is actually worth.
The standard target is a 3:1 ratio: your Customer Lifetime Value should be at least three times your CPA. Spend $1,000 to acquire a customer worth $3,000 over their lifetime, and you've got room to cover overhead and still turn a profit. That $3,000 figure depends entirely on accurate customer retention data, not a rough guess at how long customers typically stick around.
We'll go deeper on how to calculate your own acceptable CPA in the next article in this series. For now, just know the ratio exists and it's the number that actually matters, not the raw CPA figure by itself.
Most teams calculate CAC once a quarter, from a spreadsheet, stitched together from exports out of three different tools. By the time that spreadsheet is finished, the campaign that's been bleeding money has already run for three months.
The problem isn't the math. It's that campaign spend lives in your ad platforms, and customer data lives in your CRM and billing tools. Nobody's watching the two side by side in real time.
That's exactly the gap Grid closes. With real-time reporting connecting your CRM, billing, and marketing spend, you can see CPA by channel as it happens, not three months after the damage is done.

After hearing the feedback from our customers, we're excited to finally share our all-new AI Analyst, which is available to all Grid users today.
In this post, we’ll spotlight the most common SaaS reporting errors and why they occur.
%20(2).png)
Track the SaaS sales pipeline metrics that actually drive growth while connecting pipeline, retention, and unit economics.
.avif)
Big updates to dashboards and pipeline metrics!