
SaaSGrid is now Grid! Read about our evolution here.
This post was written by Grid co-founders David Sacks and Ethan Ruby, and originally appeared in David's blog "Bottom Up by David Sacks".
In a previous post, we defined The SaaS Metrics That Matter to explain the growth, retention, and efficiency metrics that every SaaS company should be tracking. This post expands on that topic by breaking down the most important sales pipeline metrics to add to your reporting stack.
Analyzing sales pipeline is vital for forecasting future growth and learning where your product and GTM process needs to improve.
Too often we see startups turn to unreliable heuristics like top-down growth goals or how the sales team “feels” when making key decisions. Below, we detail the key pipeline metrics you should start tracking in order to make data-driven decisions.
For most SaaS companies, pipeline generation is the rate-limiting factor on growth, so this is the most important place to start.
When a sales rep talks to a lead and determines they are qualified to buy the product, an opportunity is created. If the number of new opportunities is growing month-over-month, growth will be greater than linear, and the company should hire more sales reps.
Conversely, if new opportunities are flat there is a demand generation problem, and more resources need to be put into marketing.
Breaking down opportunities created by the marketing channel they came from can help focus the business on the highest ROI channels.

Sales teams should track the expected dollar value (typically in ARR) of each opportunity, summing this amount for new opportunities shows the Pipeline Value Created.
This amount tends to be more accurate for later-stage pipeline; when opportunities are created a rough estimate is entered, and as sales learns which products the prospect is likely to buy this number becomes more precise.
Win Rate is the percentage of created opportunities that eventually become won deals. While there is a general heuristic that win rates should be ~20%, this can vary dramatically based on how individual companies define qualified opportunities and sales cycle dynamics.
Multiplying pipeline value by win rate produces an expected ARR value from newly generated pipeline. To get a more precise forecast, you can break down these metrics by variables like segment (e.g. SMB, mid-market, enterprise), industry, and region.

Pipeline Conversion metrics detail how opportunities move through the sales funnel and answer two questions: 1) how long will it take for opportunities to close, and 2) where in the sales funnel is there room for improvement?
Sales Cycle Length is the number of days opportunities take to be won. While pipeline value and win rate show how much pipeline is likely to close, Sales Cycle Length suggests when it will close.
Understanding Sales Cycle Length is essential for capacity planning: sales reps can only work so many deals at a time, so longer sales cycles means more reps are necessary.
If your Average Selling Price (ASP) isn’t sufficiently high to support long sales cycles, CAC can explode and the business can become inefficient. Long sales cycles can also be a sign of weak product-market fit. Generally speaking, the more the product addresses customer needs, the faster customers will buy.
Make sure to evaluate Sales Cycle Length by segment. Enterprise deals will have long sales cycles, but their high ASP can make the extra time worth it. Conversely, SMB deals should have short cycles to go with lower ASP. In every segment, find the balance that keeps CAC payback fast.
Sales Cycle Length shows the average time to close, but in practice opportunities will have a wide distribution. Knowing when in the sales cycle opportunities are won, and when they are lost, is vital for forecasting ARR.
Cohorted Win Rate groups opportunities by the period they were created and tracks the percentage of opportunities that are won, lost, and remain open in each subsequent month.
This metric requires creating a full history of each opportunity so you can see a “snapshot” of an opportunity’s details at a specific point in the past. This is difficult without software like Grid.

This cohorted view often reveals unexpected trends. For example, you might learn that many opportunities are lost in the 2nd month, but opportunities that are open past then are won at a very high rate, even if the sales cycle drags on several more months. This can help focus your team on getting your prospects through the most difficult parts of the sales cycle and eventually increase win rates.
Opportunity stages are how a company defines the steps in their sales cycle. While this will differ company-to-company, standard stages will look something like:
Stage Conversion Rate is the percentage of opportunities that reach a certain stage and subsequently advance to a later stage. For example, a Stage 2 conversion rate of 40% means 40% of deals that reach Stage 2 eventually hit Stage 3 or later.

Stage Conversion Rates can reveal why opportunities in the pipeline are being lost, for example product gaps, pricing, or problems getting executive sponsorship. Focusing on stages with low conversion rates can be the highest ROI way to improve overall win rates.
Another variation of this metric is to look at Win Rate by Stage, which is the percentage of deals that reach a certain stage and eventually make it all the way to a Closed-Won opportunity.
Average Time per Stage layers in the number of days your opportunities spend in each stage. A long time in a stage implies either opportunities are getting “stuck” and you should explore ways to accelerate, or opportunities are actually moving down the funnel during this time, and more stages should be added to better record status.
With a firm understanding of how your sales funnel operates, you can use your active pipeline to build highly accurate forecasts for the next 1-2 quarters.
All opportunities have a “Close Date,” which indicates the sales rep’s best estimate of when the opportunity will close.
Having reps be diligent and realistic with close dates is key to pipeline hygiene. Looking at the currently open pipeline by close date will tell you which opportunities will make or break the quarter.
Segmenting pipeline by stage provides more detail on where these opportunities sit in the funnel.

Weighted Pipeline is the sum of ARR x probability for open opportunities. The probability of an opportunity closing is assigned based on the opportunity’s stage. For example:
If stage probabilities are accurate, the Weighted Pipeline metric is a good representation of how much ARR will be added. Many companies use arbitrary probabilities, which hurts accuracy, but Grid produces highly accurate stage win rates you can use to update your CRM, making Weighted Pipeline a reliable metric. Once probabilities are accurate, you can look at Weighted by close date to pinpoint where the team will land.
Once you understand your Weighted Pipeline for the quarter, it’s time to get tactical and review the individual opportunities. “Deal review” meetings are where the sales team’s qualitative feedback meets quantitative sales pipeline metrics: by combining what you know about likelihood to close from your pipeline metrics with your rep’s analysis of buyer sentiment, you can start to strategize using tactics like discounts, customer references, and founder calls to get your deals across the line.
During deal reviews, the Pipeline Waterfall is a powerful tool for visualizing pipeline momentum. The Pipeline Waterfall tracks how pipeline changes between two points in time. Most helpfully, you can see how your pipeline closing this quarter has changed in the past 30 days from factors like:

Pipeline reporting usually concentrates on opportunity creation, stage conversion, and Closed vs Won.
However, most economic value comes after the initial sale because revenue accrues over time and we should always keep in mind it can expand, contract, or churn.
Here are the main factors you should take into account beyond acquisition.
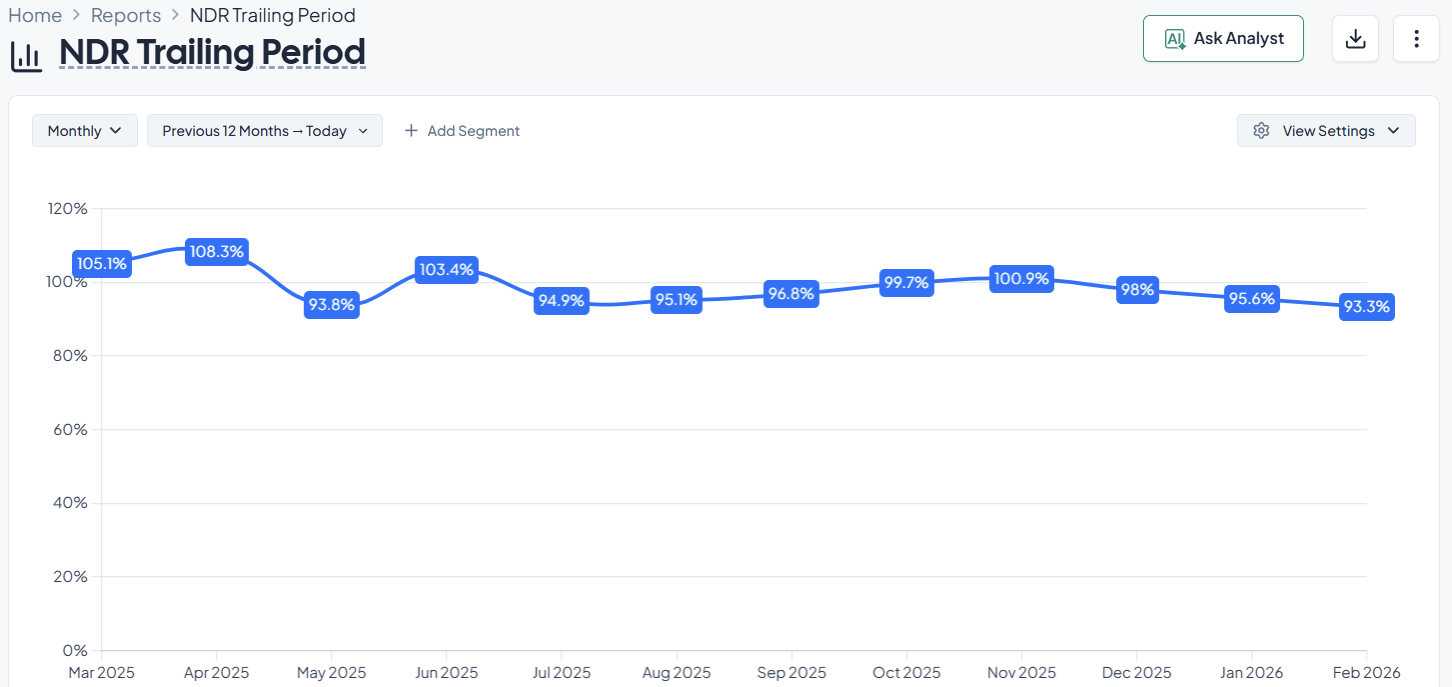
NRR captures how recurring revenue from a defined customer cohort changes over time after accounting for expansion, contraction, and churn. It is commonly used as a compact indicator of product stickiness plus expansion motion.
Typical structure:
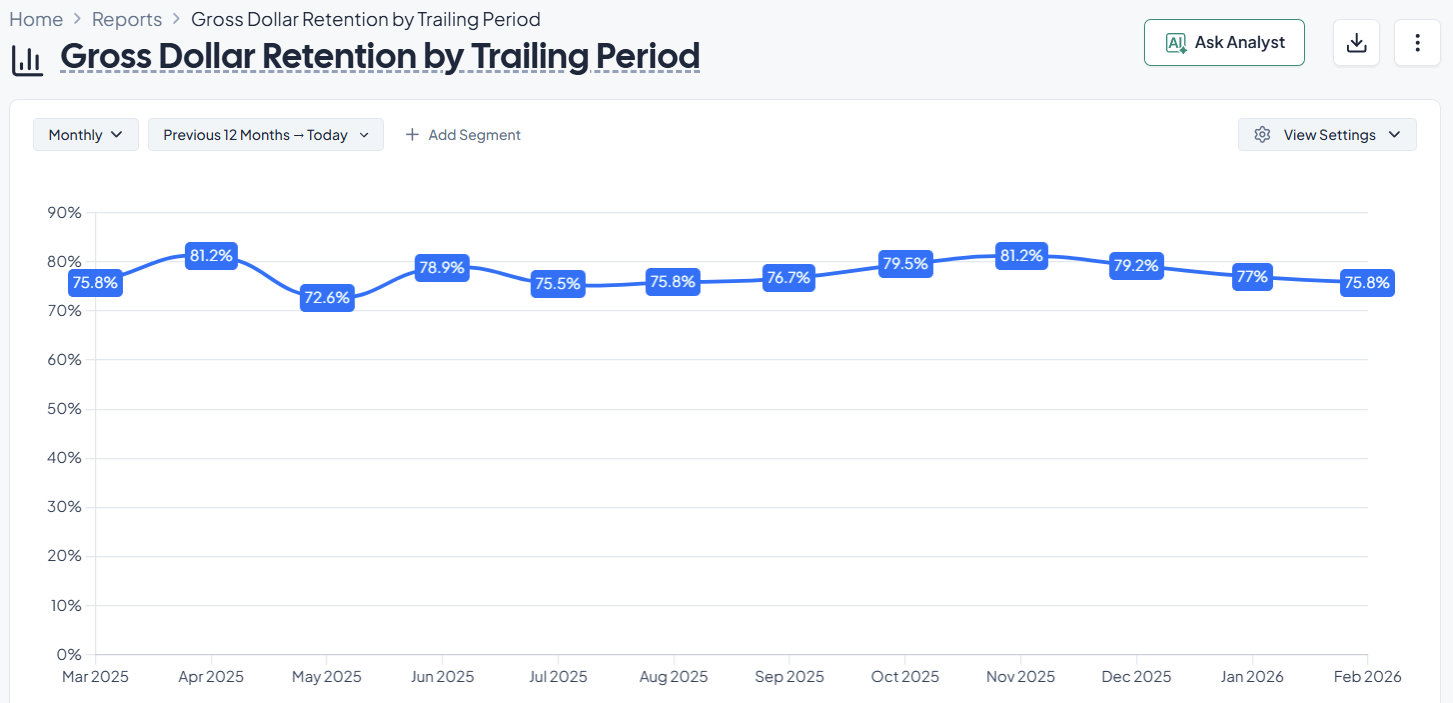
GRR isolates how much of the original recurring revenue base you retain, excluding expansion. It answers the question: If no one upsold, how much recurring revenue would remain?
Remember that GRR removes upsells and expansion effects, so it will be smaller than NRR by definition, this normal and isn’t necessarily cause for alert.
Negative churn is a state where expansion and reactivation exceed churn and contraction, so the installed base grows even if new customer acquisition slows.
It’s very important to distinguish between:
This distinction matters the most when contract values vary widely. For SaaS Businesses using a tiered subscription system it's specially important.
Unit economics is the bridge between two key concepts, pipeline growth and sustainable growth. The core question your business should be asking is:
Can this business earn more gross profit from customers than it costs to acquire them, within an acceptable time horizon?
Just think if it makes sense to buy a TV for $100 and sell it for $80. Maybe your SaaS business gets a profit but it's $5/month for the first 20 years. Are those business models actually sustainable?
This measures how much lifetime gross profit you can expect from a customer relative to how much you spend to acquire them.
A commonly cited rule-of-thumb is that a healthy LTV:CAC is around 3:1 or higher, At the same time, very high ratios can imply underinvestment in growth or unrealistic assumptions.
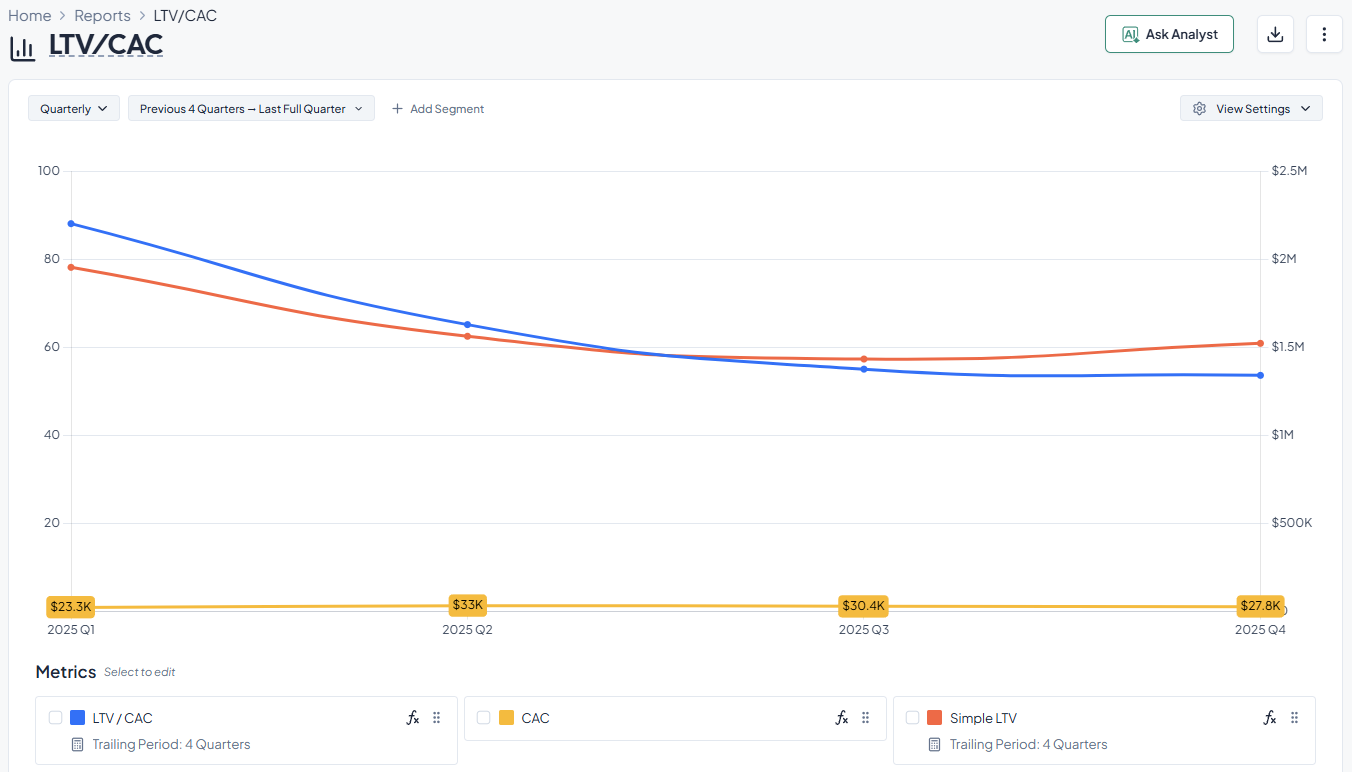
CAC payback period tells us the time, usually measured in months, to recoup CAC using gross profit from the customer. Ideally we want this period to be less than 12 months. While this is the most common threshold, faster payback is seen as stronger.
SaaS growth can deepen accounting losses and cash needs in the near term because acquisition costs are front-loaded while subscription revenue is realized over the customer lifetime.
How do we apply this?
Grid is an easy way to dashboard your SaaS and sales pipeline metrics.
Grid integrates directly with your Salesforce or HubSpot account and automatically produces standardized and auditable pipeline metrics. These metrics can then be combined with the growth, retention, and efficiency metrics that Grid already tracks to create customized dashboards that serve as the single source of truth for your business.
You can read the details of how Grid calculates these metrics in our Metrics Library. To learn about using Grid at your own company, book a meeting with the team.
Sales pipeline metrics are essential to the SaaS reporting stack. When done correctly, they help you:
Because many of these metrics require complex data engineering to calculate, however, we often see them missing from companies’ reporting stacks. Thanks to Grid, you now have a shortcut to solve this problem.
___
Special thanks to Grid investor Brian Strubbe for his insights and feedback on this blog.

.jpg)
As part of our most recent product launch we revamped our “Retention” chart to show non-cohorted retention rates.
.jpg)
Explore updates to the Grid home page, report tagging, new dashboard templates, Workspace Data, and more.

Grid and traditional Financial Planning and Analysis (FP&A) platforms each offer powerful reporting capabilities and operational clarity for growing SaaS companies.

Grid’s latest updates let you merge customers, apply segments, and personalize dashboards.

