
SaaSGrid is now Grid! Read about our evolution here.
The story of reconciling mismatched metrics across your teams is all too common for SaaS businesses. Your board deck shows 15% MRR growth, finance reports 10%, and your CRM displays something completely different. Which one do you trust? It decides whether your company can raise in a downturn.
While SaaS businesses generate more data than ever before, most SaaS reporting tools fall short of providing a reliable business overview. As a result, sales, finance, and RevOps teams often run metrics calculations through data exports in Excel a manual process that often leads to errors.
Fortunately, you don’t have to settle for this fragmented approach. In this post, we’ll spotlight the most common SaaS reporting errors and why they occur. We’ll also show you how to prevent them, so you can transform your raw data into trustworthy insights that fuel confident decisions.
Accurate SaaS reporting is critical to maintaining trust across teams and investors. But when reporting errors go unchecked, you risk reports that mislead your team and erode stakeholder trust. Knowing what causes these issues and how to fix them keeps your metrics credible and your decisions focused.
SaaS teams often count the same contract twice (or more) across different categories due to limited deduplication or a lack of proper baselining. This frequently happens when new business revenue and expansion revenue from the same contract are recorded separately, or when upgrade revenue is recorded alongside the original subscription.
Here’s how you end up double-counting revenue: Your customer upgrades from a $100 to a $300 monthly plan. Suddenly, the same contract appears in both the new business and expansion categories. This is especially common when a customer changes plans mid-month or moves from one sales rep to another. These mistakes inflate recurring revenue and distort calculations like CAC payback and churn rate.
Different teams sometimes classify customer events as churn without distinguishing between customer cancellations, downgrades, or temporary suspensions. Misclassification occurs when teams use inconsistent churn definitions or lack clear guidelines for how different types of revenue loss are categorized in their reporting. This can lead to treating all revenue decreases as churn without distinguishing between customer loss and revenue contraction.
It’s important to recognize that not every drop in revenue means a customer is lost. Only complete cancellations should be counted as true churn. Other events such as downgrades (moving to a lower-priced plan), temporary suspensions (pausing a subscription), or reductions in add-ons or user seats should be tracked separately as revenue contraction or temporary loss, not churn.
Misclassifying these events is especially common with complex subscription models with multiple product tiers and add-ons. Treating all revenue decreases as churn can trigger unnecessary retention strategy investments and false alarms across customer success and leadership.
Time-based errors happen when SaaS businesses rely on inconsistent date references or misaligned time periods to compare metrics. One common mistake is using the contract close date (booked ARR) instead of the contract start date (live ARR) to recognize revenue. This results in growth and ARR being recognized before it’s actually earned, making your reported metrics appear artificially high or out of sync with actual service delivery.
For instance, if a contract is signed in December but the service starts in January, recognizing revenue at close inflates December’s numbers and misrepresents your true MRR or ARR. Similarly, using signup dates instead of revenue start dates can delay recognition and make your performance look worse.
This happens frequently when you have complex billing cycles like annual contracts or mid-month starts or when data from different systems uses different timestamp references. This can lead to misaligned financial reporting, inaccurate growth metrics, and confusion across teams.
Another common issue occurs when teams compare metrics across inconsistent time periods. Mixing calendar and fiscal years or comparing January MRR against Q4 CAC, for example, might falsely signal inflated acquisition costs or skew your understanding of business performance.
Teams might calculate metrics by averaging individual customer rates rather than computing aggregate changes across the entire customer base. Averaging it feels intuitive and is easier to calculate in spreadsheets, but it gives equal weight to each customer regardless of their revenue size.
For example, if one customer pays $10,000 and keeps all their business (100% NRR), and another pays $1,000 but cancels (0% NRR), the average is 50%. But aggregating shows you kept $10,000 out of $11,000, which is about 91% NRR.
Averaging NRR can mislead performance analysis, influence valuation multiples, and affect your growth strategy by underinvesting in high-value accounts.
When calculating Cost of Goods Sold (COGS) and gross margin, teams often miscategorize expenses, which can result in misleading profitability metrics. This typically happens when expenses like customer support, hosting, or third-party platform fees are left out of COGS or when sales and marketing costs are incorrectly included.
As a result, the gross margin will appear higher or lower than the true value, leading to inaccurate profitability reporting. For example, if you exclude cloud hosting from COGS, your gross margin will be artificially high. On the other side, including sales commissions in COGS (instead of as an operating expense) can make your margins look artificially low.
These errors often occur when teams rely on legacy accounting practices or don’t have standardized rules for classifying expenses. Over time, these inconsistencies can make it difficult to benchmark performance or communicate results to investors.
Inconsistencies in how SaaS metrics are defined and calculated can quickly undermine the reliability of your reporting. When teams use different formulas or definitions for key metrics like churn, CAC, or even the Rule of 40 your reports become difficult to compare.
This often happens when metric documentation is missing or when teams manually calculate results in spreadsheets. For instance, one team might use EBITDA margin for the Rule of 40, while another uses net revenue margin, or ARR growth gets substituted for revenue growth in the formula. Similarly, churn might be calculated by customer count in one report and by revenue in another.
These inconsistencies make it nearly impossible to compare performance across teams or periods and can lead to manual errors that undermine decision-making.
SaaS businesses often operate with siloed data spread across CRMs, billing platforms, and spreadsheets. Each system holds incomplete or outdated information, so when you try to build a comprehensive report, the numbers don’t line up.
Your CRM might list a customer as active, for example, while the billing system excludes them due to a missed payment. Even with tools like Salesforce or HubSpot, you’re still relying on manual workarounds like spreadsheets, copy-paste fixes, or outdated formulas.
As the business grows, data volume and complexity compound. Integration failures and lagging syncs introduce discrepancies that can go undetected. And because metric definitions like ARR, churn, and CAC vary across teams finance might include only paying customers, while sales includes trials your reports reflect mismatched assumptions.
These inconsistencies become even more obvious when stakeholders get the same static report, simply because tailored views take too long to produce. Without the ability to drill into the details, teams miss the precise insights they need to make strategic decisions.
The right reporting habits catch discrepancies early and keep your data aligned. Start with these proven practices to ensure your metrics stay accurate and decision-ready.
Connect all business systems CRM, billing, and finance to create a single source of truth. This eliminates data silos that lead to duplicates or inaccuracies and enables consistent metric calculations across teams.
With Grid, you can centralize all your systems automatically. The platform pulls real-time metrics from your CRM, billing, and finance tools no manual exports required. For example, Tecton’s BizOps, finance, and sales teams all spent hours manually compiling CRM and billing data for board updates. After switching to Grid, they now build investor-ready dashboards in minutes cutting board reporting time by 90%.
Grid supports custom fields, aligns reporting logic across tools, and audits incoming data to ensure accuracy from day one, all without adding operational overhead. Instead of playing data detective across different tools, you get one source of truth that actually works.
Automation reduces manual work and ensures the accuracy and auditability required for financial reporting. This is especially important for SaaS businesses with complex subscriptions or deferred revenue.
Grid offers a purpose-built alternative: a SaaS-native platform that combines deep data integration with embedded metric logic and compliance controls.
You can drill into any metric to see exactly how it was calculated and trace every number back to its source system no guesswork or reconciliation required. Grid also lets you customize revenue recognition rules to align with your business model, so you stay compliant without compromising on reporting flexibility.
Take Hourly. Before automating, this Series A startup exported CRM data, cross-referenced billing in spreadsheets, and recalculated everything manually a process that took hours each month. Now, they monitor revenue and retention in real time, giving investors self-serve access to financial metrics and saving 10 hours a month on board reporting.
Grid also reconciles CRM bookings with billing actuals, flags discrepancies, and ensures revenue is recognized according to accounting standards. Instead of managing fragile automations across disconnected tools, companies like Hourly run everything through a system built specifically for SaaS reporting, so nothing needs to be retrofitted or rebuilt.
To ensure consistent and reliable reporting, you need documented definitions for your core SaaS metrics like ARR, churn, CAC, and retention. Even subtle differences like which customers and revenue movements are included can dramatically shift the narrative around your growth or retention.
For example, when defining net dollar retention (NDR), document whether you’re using a trailing period, cohort, or renewal approach. Specify the measurement period and detail exactly how you account for expansion, contraction, and churn, ensuring your NDR figures are comparable across reports and periods. This consistency not only improves internal alignment, but also ensures your reported metrics are credible with investors and stakeholders.
Create a shared metric dictionary with clear definitions and instructions for edge cases, including formulas when needed (for example, whether to count paused accounts or how to handle partial churn). If you’re using multiple systems to calculate these metrics, run periodic audits to spot and resolve discrepancies.
Grid automatically calculates every metric using industry-recognized formulas. You can build centralized dashboards with 150+ standardized SaaS metrics out of the box. These definitions are embedded across every view, and you can customize them to align with your internal strategies, including how you handle edge cases for retention, such as paused accounts or contract renewals.
Standardizing your reporting periods helps surface the trends that actually matter. Cohort analysis can reveal long-term value patterns that aggregate metrics often miss especially around retention and upsell behaviors. Rolling averages smooth out short-term volatility, giving you a clearer view of long-term performance.
Align your reports to fixed calendar periods monthly, quarterly, annually and clearly document any exceptions.
With Grid, you can also import custom CRM fields to create precise cohorts and apply prebuilt settings like live versus contracted ARR to tailor your analysis.
Each team has different priorities executives focus on growth benchmarks, RevOps tracks pipeline performance, and finance analyzes retention and payback metrics. Grid makes it easy to deliver tailored dashboards to each audience without sacrificing consistency.
For Branching Minds, board prep meant reconciling data across tools and reformatting reports for each stakeholder group. With Grid, the EdTech company generates 100% accurate, role-specific financial views in seconds with one-click, SKU-level breakdowns and real-time visibility into state-by-state revenue. Flexible access controls let them deliver exactly what each leader needs without duplicating work.
With Grid, every decision-maker gets the insights they need without extra work or conflicting numbers.
Grid is the only dashboarding tool designed specifically for SaaS businesses. It handles upgrades, downgrades, and complex billing logic natively. That means no double-counted ARR, no mismatched dates, and no Excel gymnastics.
Grid empowers your team with:
If you’re ready to eliminate manual fixes and unlock real-time visibility across your business, it’s time to upgrade your reporting stack. Get this right by segmenting and personalizing data in Grid.
Book a demo today and experience how Grid powers error-free reporting across every team.


Compare five financial dashboard tools for SaaS teams and see which fits your revenue, reporting, and planning needs best.

It’s no secret that market conditions have changed since the liquidity filled boom of 2020 and 2021.
.png)
We outline the growth metrics every SaaS company should track to identify growth opportunities and optimize their go-to-market strategy.
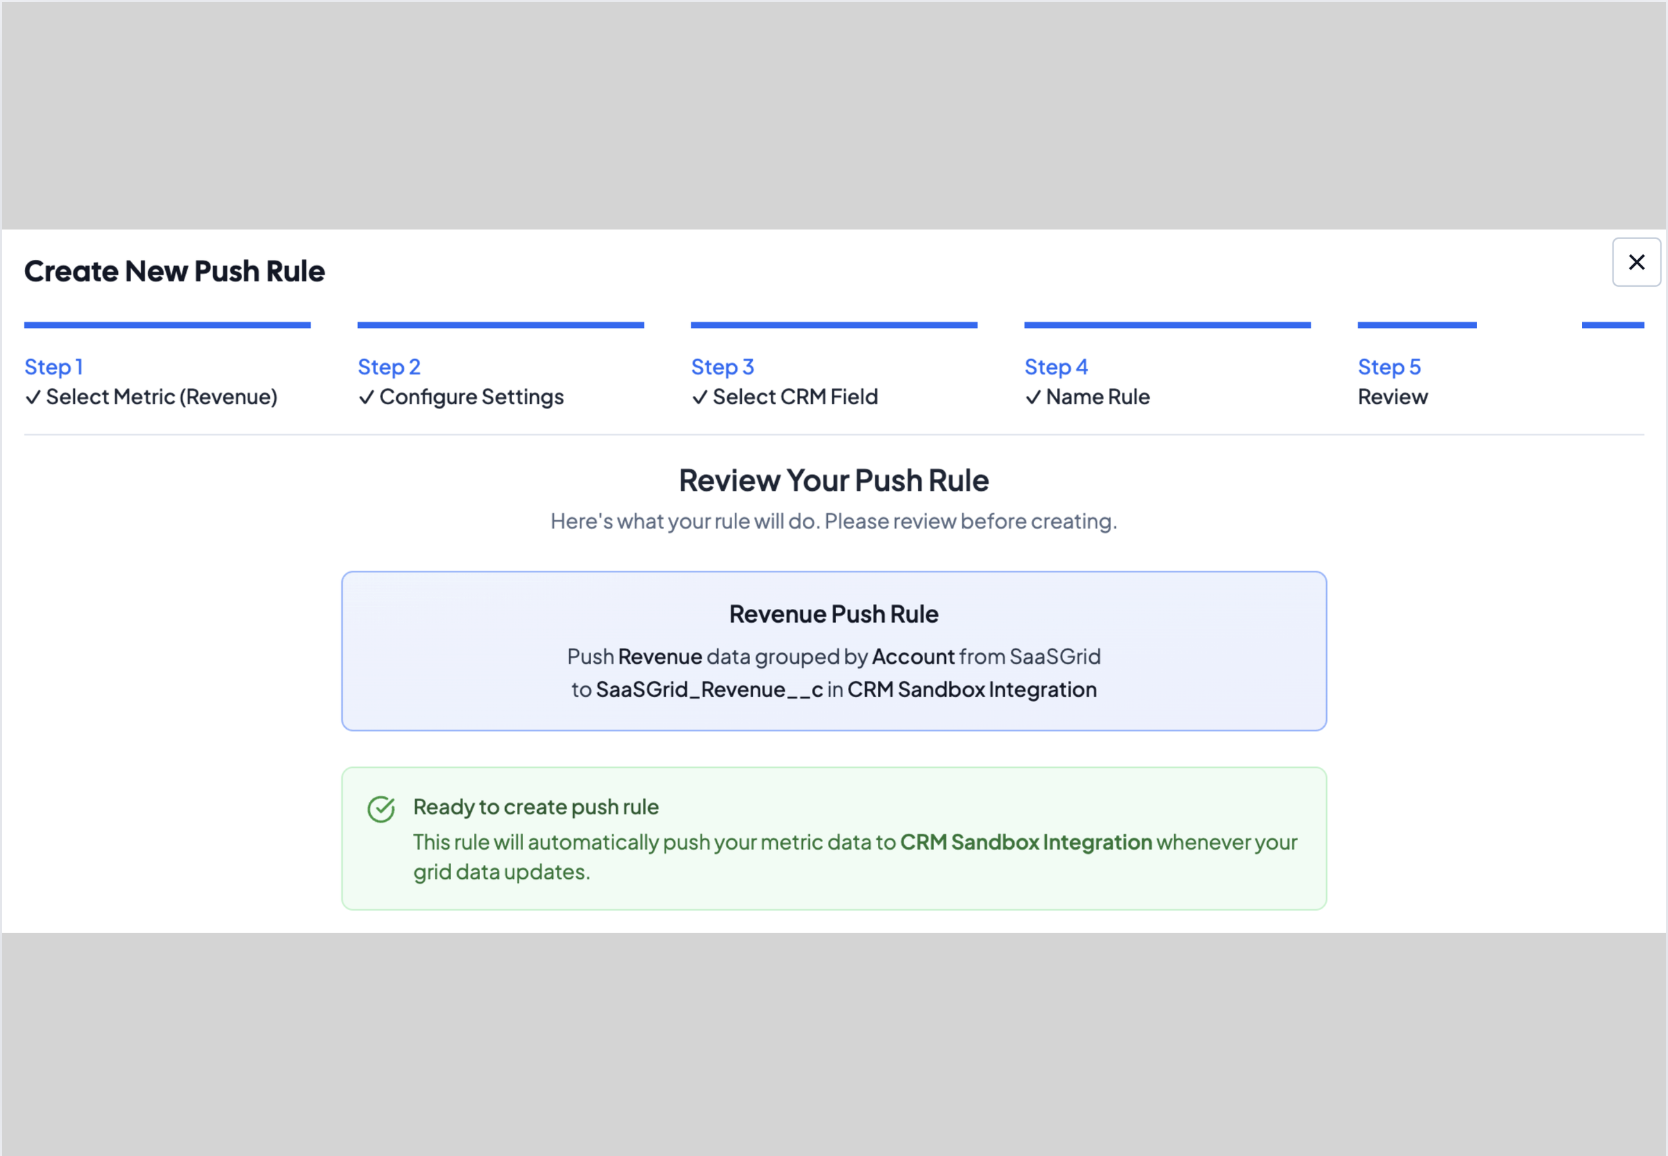
Push data from Grid and your integrations to CRM!

