
SaaSGrid is now Grid! Read about our evolution here.
We’re excited to announce that we’ve launched a suite of design updates to enhance how you use Grid. We’ve redesigned our home page to improve organization, navigation, and collaboration, and added a new unified view of your Workspace Data.
Redesigned Home Page
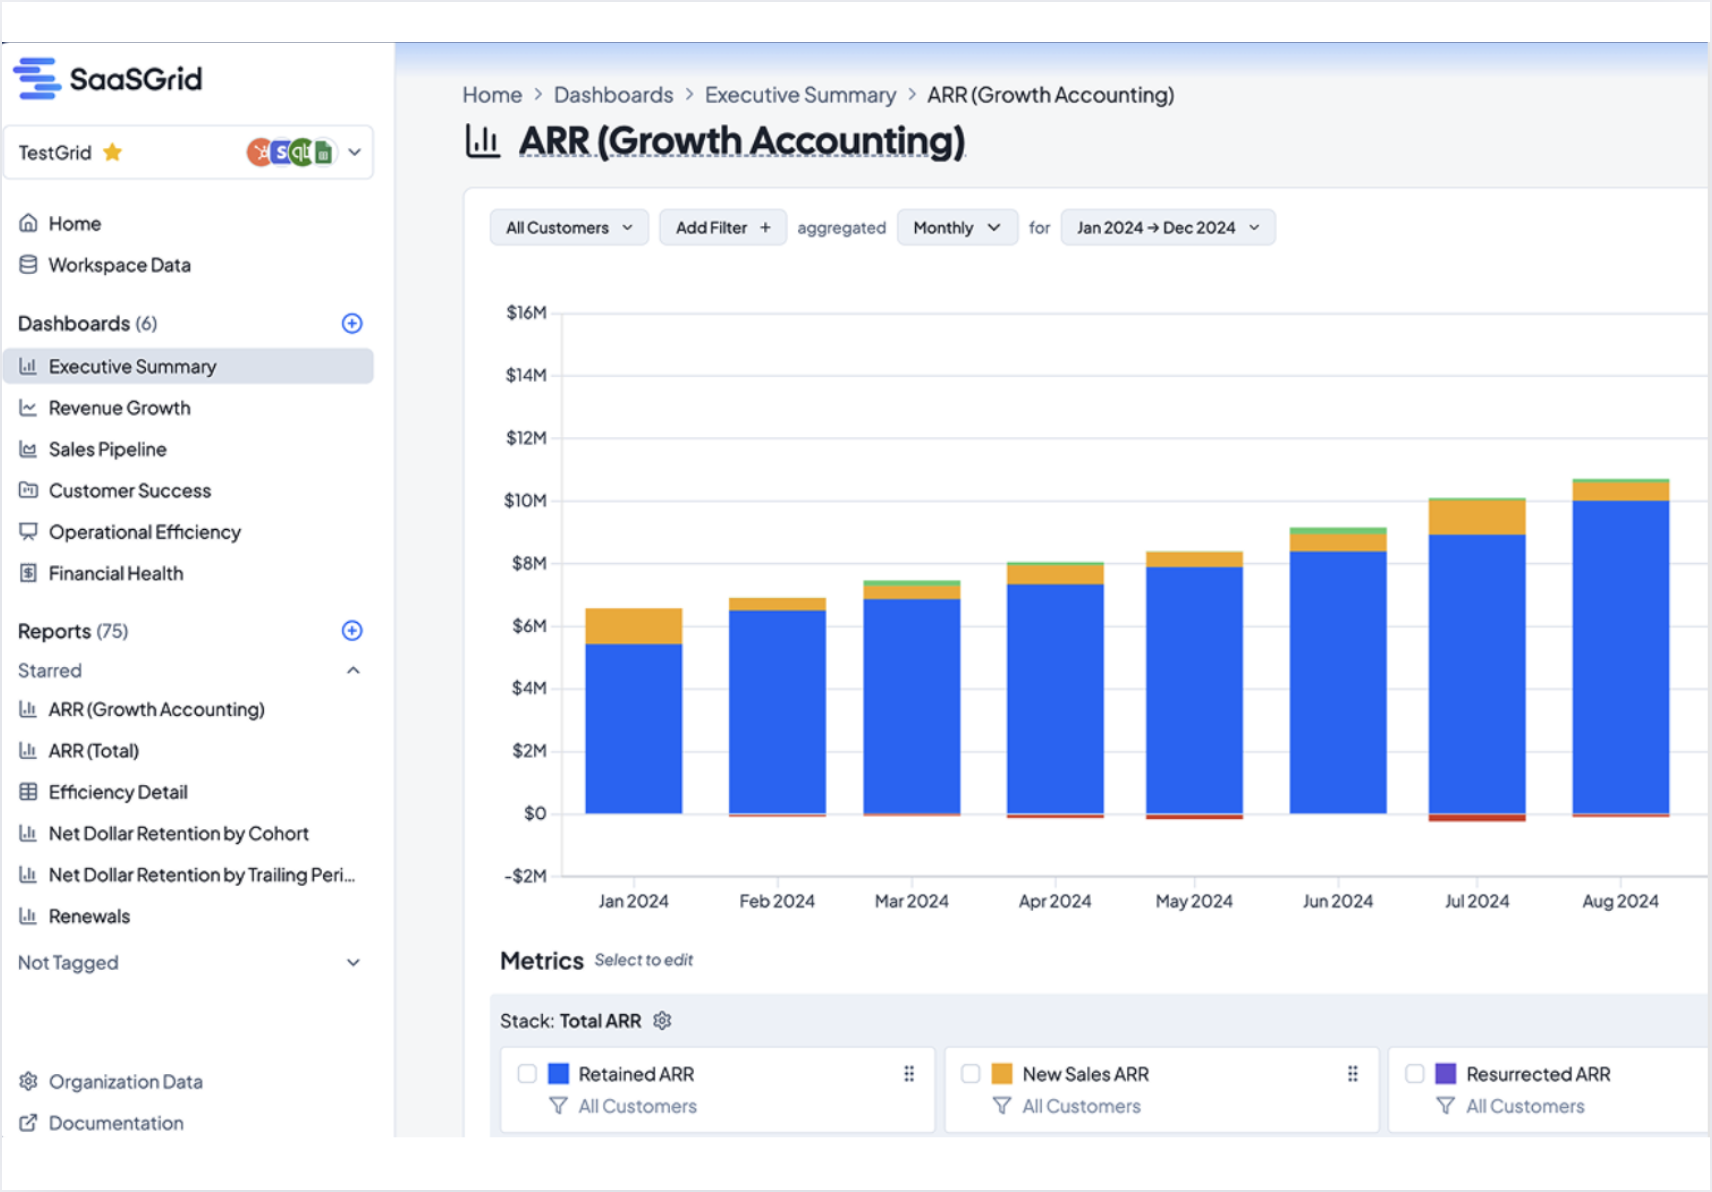
When you log into Grid, you will now land directly on a new Workspace specific home page. From here you can see all your dashboards and data sources in one streamlined view, making it easy to track where your data originates and gain insights faster. If you have multiple Workspaces, Grid will give you the option to designate a default Workspace

Enhanced Navigation Bar
We've optimized the navigation bar for easier sorting, grouping, and tagging of reports. Whether you’re tagging reports by project, grouping them by department, or starring them for quick access, the improved navigation bar ensures that every report is readily accessible. If you’re working across multiple Workspaces, switching is simple– just click the dropdown in the Workspace box to toggle between them.
We’ve also added new dashboard templates that align metrics with department KPIs, focusing your teams on metrics that matter most to them. For example, you can start with a Customer Success template to get insights into retention, or track your P&L with the Financial Health dashboard.
For more information on navigating Grid, visit our help center here.

Unified Workspace Data
Workspace Data is a single unified view of all your customers, expenses, and headcount data that you can access without switching between data sources. This update lays the foundation for customer merging and reconciliation across your data sources, which we will be releasing soon.
For more information on configuring data sources in Grid, check out our help center here.

Interested in leveraging new integrations? Book a call with us to learn more.

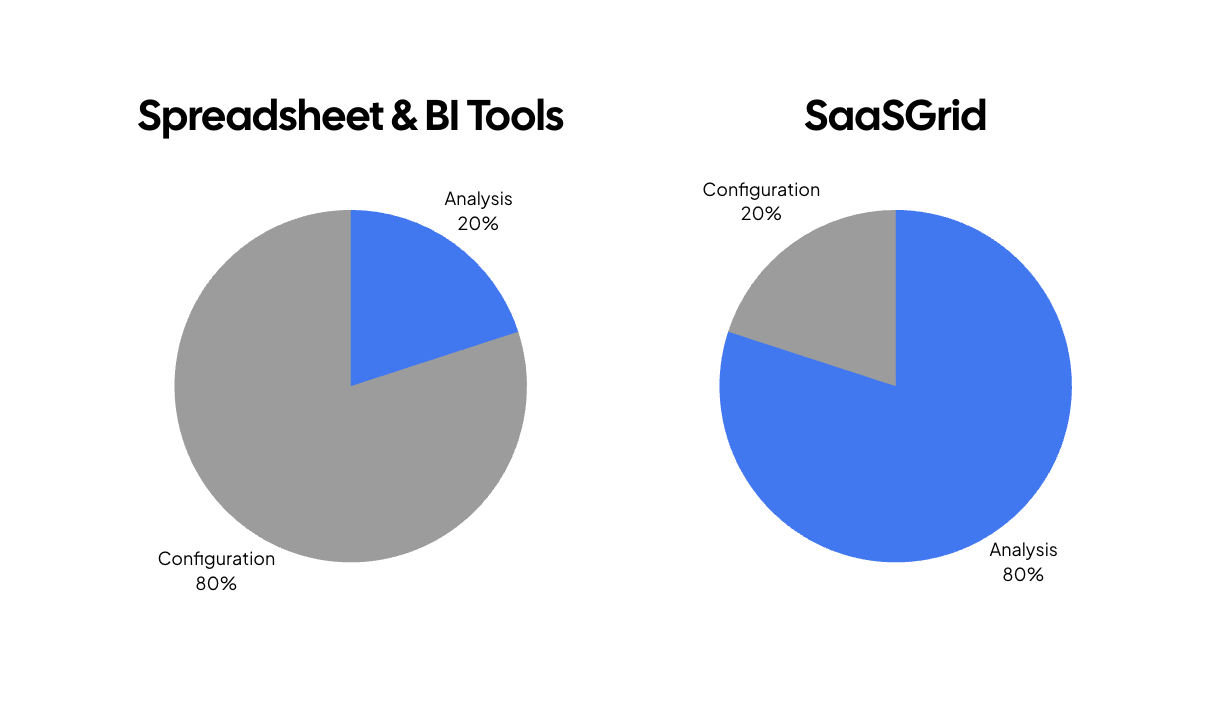
An all-in-one tool like Grid lets you track and visualize every dollar in your business automatically.

Compare five SaaS analytics tools and see how each supports revenue, product insights, and decision making.
Turn your financial data into crystal‑clear, investor‑ready SaaS metrics.
.avif)
Big updates to dashboards and pipeline metrics!

