The Best Financial Dashboard Software + What Tools Do You Actually Need?
Compare five financial dashboard tools for SaaS teams and see which fits your revenue, reporting, and planning needs best.
By Ethan Ruby, Grid Co-Founder and CEO
SaaS companies need financial dashboards to keep an eye on their teams' performance, costs, and revenue.
But as you might have already experienced, as your subscription models get more complicated, finance teams need to be able to see everything clearly and accurately without having to deal with the complications of manual spreadsheets.
What’s Financial Dashboard Software and Why SaaS Businesses Need One
Financial dashboard software is a reporting layer that sits on top of your accounting, CRM, billing, and sometimes product data to give you real-time visibility into your company’s financial performance.
While an accounting software records what happened, a financial dashboard software helps you understand what’s happening and what might happen next.
For SaaS companies, this becomes critical as soon as revenue models get even slightly complex.
What Your Financial Reporting Tools Should Tell You By ACV Segment
Your financial reporting tools should match the kind of customers you have. A SaaS company selling to SMBs doesn’t need the same reporting depth as one serving enterprise clients.
As ACV goes up, reporting changes from tracking volume and churn to managing renewals, accuracy of forecasts, and governance.
Now, let's take a look at five financial dashboard software platforms and focuses on how each tool helps with tracking revenue, reporting workflows, and making decisions.
The Best Financial Dashboard Software
Tool
Best For
Strengths
Limitations
Pricing
User Score
GridTop Pick
SaaS companies with > $1M ARR needing revenue-focused financial dashboards
Automated dashboards for recurring revenue and SaaS metrics
Standardized metric definitions across finance and RevOps
Near real-time updates from billing and financial systems
Replaces spreadsheets and manual exports with a single reporting layer
Learning curve for advanced automation capabilities
Some automation features are still maturing
Free to Custom Pricing
4.6
Multiview ERP
Mid-sized to large organizations with complex accounting needs
Unified financial dashboards across GL, AR, and budgeting
Role-based dashboards for executives and managers
Strong reporting depth with audit trails and consistency
Some workflows require extra steps
Learning curve after interface or workflow changes
Can feel complex for new users
Available through demo only
4.2
Runway Financial
Mid-market SaaS teams focused on FP&A and scenario planning
Real-time dashboards for revenue, burn, and forecasts
Flexible financial modeling and scenario analysis
Clean interface compared to spreadsheet-based FP&A
Steep learning curve for teams without finance background
Product maturity still evolving
Onboarding can be challenging due to feature depth
Available through demo only
4.8
Datarails
Finance teams that rely heavily on Excel but want more automation
Centralizes data from accounting, CRM, and banking systems
Real-time dashboards for P&L, cash flow, and KPIs
Maintains existing Excel-based financial models
UX issues in some dashboard views
Adoption can be difficult outside finance teams
Requires understanding of data modeling logic
Custom Pricing
4.6
Databox
SaaS teams needing quick, real-time KPI visibility
Fast setup for real-time performance dashboards
Broad integrations across CRM, billing, and product tools
Low learning curve for non-finance users
Limits on dashboard size and visual customization
Gaps in some integrations
Limited support for advanced financial modeling
Free to Custom Pricing
4.5
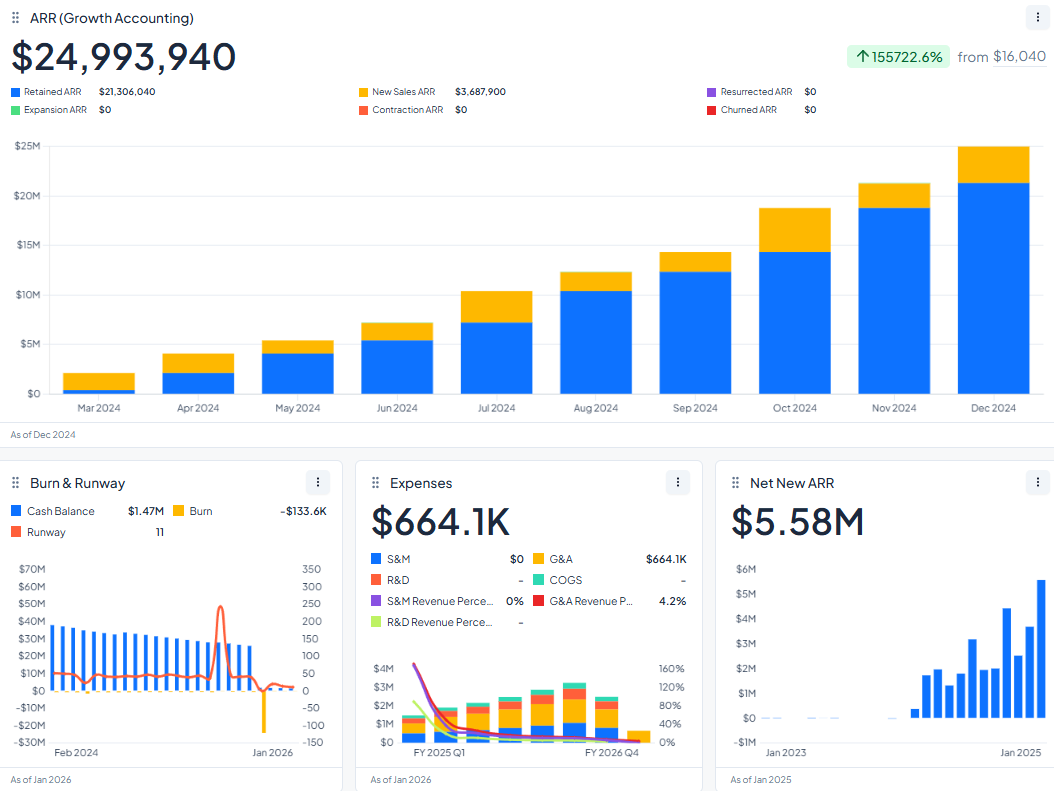
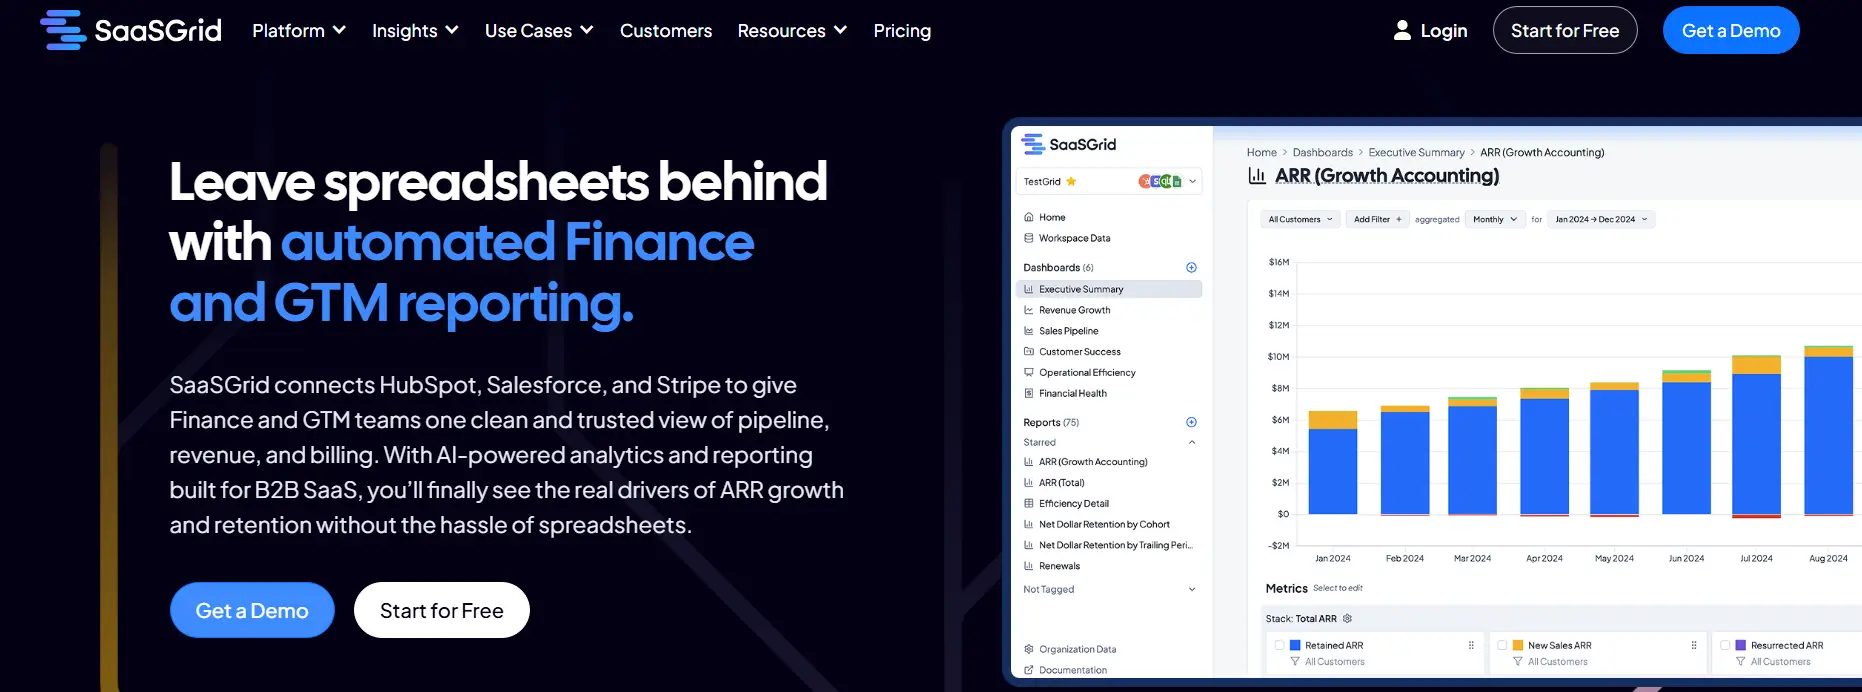
1. Grid: Revenue Focused Financial Dashboards
Grid is a financial dashboard software made for SaaS companies that need to keep an eye on their recurring revenue and performance metrics continuously.
This software helps with revenue recognition by putting billing, subscription, and financial data into standardized dashboards that automatically update when your source systems change.
Grid is a financial dashboard software that helps finance and RevOps teams work together by making it easier to reconcile their work.
It figures out important SaaS metrics, uses the same definitions every time, and updates reports on a set schedule, allowing your team to use one reporting layer instead of spreadsheets. Its dashboards replace manual exports and make numbers clearer and easier to see in near real time.
Grid is a good choice for SaaS teams looking for the best financial dashboard software because it works well with structured revenue reporting and operational consistency.
What Users Like About Grid
Automation that reduces manual reporting work
Users frequently mention that Grid automates recurring financial and revenue reporting, reducing manual effort and lowering the risk of errors across teams.
“Grid is super effective, it helps automate reporting processes, reduce manual errors, and provides actionable insights for businesses to make informed decisions quickly.”
–
Annie C.
Dashboards that replace spreadsheets and manual exports
Several reviewers value having dashboards that update automatically, removing the need for repeated exports and ongoing spreadsheet maintenance.
“This allowed us to eliminate manual data export and reporting and view key metrics in real time.”
–
Sam H.
Integrated analytics for faster visibility into performance
Users note that consolidating metrics into a single reporting layer helps teams track trends and make decisions using current data.
“It streamlines data collection and reporting, enabling businesses to track performance, identify trends, and make data-driven decisions.”
–
Harry M.
What Users Dislike About Grid
Grid offers powerful automation and reporting capabilities, but some users point out challenges related to learning advanced features and the maturity of certain automation functions.
Learning curve for advanced automation features
Some users report that while automation is valuable, it takes time to fully understand the platform’s full range of automation and reporting capabilities.
“One thing to note: Grid is pretty advanced, so it does take some time to fully understand all of the automation and reporting capabilities.”
- Grant C.
Automation features that are still maturing
Reviewers acknowledge that parts of the automation functionality are still being developed and refined.
“As Grid is still relatively new, some features around automation are still being improved.”
- Annie C.
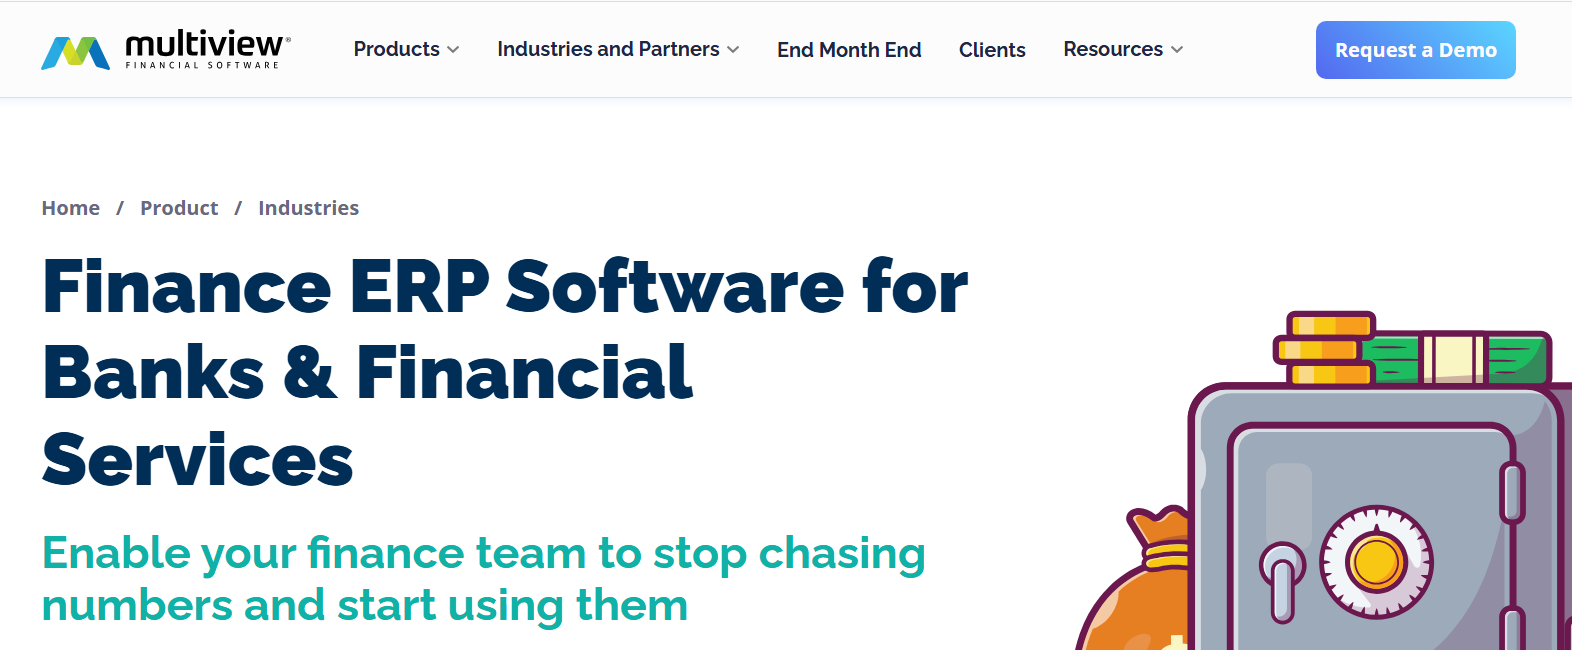
2. Multiview ERP
Multiview ERP is a cloud-based financial dashboard program that helps SaaS and service-oriented businesses keep all of their accounting and operational data in one place.
Price
Available through demo only
Ideal use case
Mid-sized to large organizations within healthcare, education, nonprofit, and utilities
It helps recognize revenue by bringing together data from the general ledger, accounts receivable, and budgeting into unified financial dashboards that can be drilled down into in real time.
Multiview ERP is a financial software for SaaS businesses that focuses on replacing spreadsheets with structured reports and automated workflows.
From one system, finance teams can keep track of income, expenses, and forecasts while also keeping audit trails and data consistent. Dashboards can also be updated and customized based on the role needed. For example, executives can see high-level KPIs, while managers can look at cost centers and projects.
Users say that the platform is best for companies with complicated accounting needs because it has strong reporting depth and self-service dashboards.
What Users Like About Multiview ERP
Easy access to financial reports and dashboards
Users often say Multiview ERP makes it easy to work with dashboards and create custom financial reports to get the information they need.
“Multiview is very user friendly and the custom reports make it easy to get the information you need.”
–
Korlynn A.
Consistent and reliable reporting
Some reviewers like that financial dashboards and reports behave consistently and align with documented functionality.
“That it performs as described, and customer service has been helpful.”
–
Ann P.
Faster and easier access to financial data
Users say having financial information available through a central dashboard makes day-to-day work more efficient.
“Multiview is very efficient and user friendly.”
–
Mandy R.
What Users Dislike About Multiview ERP
Multiview ERP offers broad financial and operational functionality, but some users report challenges related to workflow efficiency, interface changes, and initial usability.
Additional steps required for certain financial tasks
Some users say that completing certain actions in dashboards or reports requires more steps than expected, which can slow day-to-day workflows.
“Some areas have too many steps to perform one function.”
- Ann P.
Learning curve following interface or workflow changes
Reviewers note that updates to accounting or reporting screens introduce a learning curve as users adjust to new layouts or processes.
“After seeing some of the changes to the accounting screens, there is definitely a learning curve.”
- Marc B.
Initial complexity for new users
Some feedback suggests that the platform’s depth of functionality can make it feel complex and harder to use at first.
“Multiview ERP is generally considered a robust system but it can feel complex.”
- OM PRAKASH B.
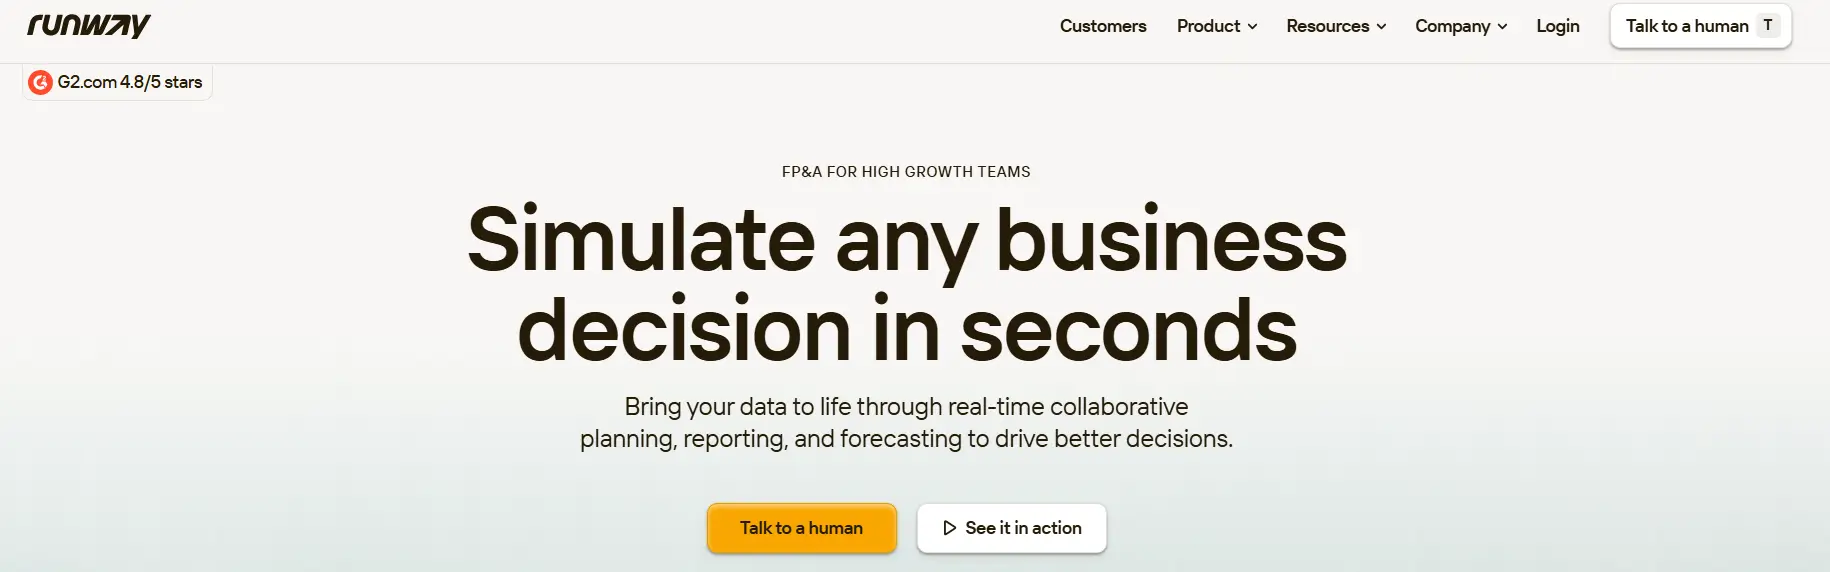
3. Runway Financial: Real Time FP&A Financial Dashboards for SaaS Teams
Runway Financial is a financial dashboard program made for SaaS companies that need to see their revenue, burn, and forecasts in real time.
Price
Available through demo only
Ideal use case
Mid-market companies that need financial planning and analysis
It helps teams and companies with revenue planning and recognition by linking accounting and CRM data into models that update automatically when actuals change.
Runway is a financial software that focuses on planning, forecasting, and scenario analysis instead of static reporting. Finance teams can make dashboards for comparing budgets to actuals, cash flow, and headcount while keeping track of changes and audit trails.
Reviews often mention that the modeling is very flexible and that the dashboards are updated in real time, which is better than using spreadsheets for FP&A.
Users also say that learning how to use it takes time, especially for teams that have never done financial modeling before. Runway is a solid choice for SaaS teams looking for a financial dashboard software that allows them to look ahead and generate reports for a board.
What Users Like About Runway Financial
Financial dashboards for planning and forecasting
Users often mention how flexible Runway’s dashboards and financial models are when it comes to planning and predicting future outcomes.
“Runway is an incredibly flexible tool with an amazing product and engineering team behind it.”
–
Brian L.
A clean dashboard and easy-to-use interface
Many reviewers say Runway dashboards feel easier to use than spreadsheets, making financial modeling more approachable.
“Runway just gets it. The UI is clean, the app is intuitive, and it makes financial modeling actually enjoyable.”
–
Austin H.
Scenario analysis built directly into dashboards
Users like being able to quickly compare scenarios and understand how changes affect their financials.
“I love how Runway makes it easy to analyse different scenarios and understand the impact on our financials.”
–
Verified User in Entertainment
What Users Dislike About Runway Financial
Runway Financial is designed for advanced financial modeling and planning, but some users report challenges related to usability, maturity, and onboarding.
Learning curve for users without a finance background
Some users say that Runway is not immediately accessible for beginners, especially those unfamiliar with finance, SQL, or modeling concepts.
“Not beginner-friendly—if you don’t know SQL, finance, or modeling concepts, there is a learning curve.”
- Austin H.
Concerns about product maturity
Reviewers note that the platform is still evolving and may require further development to feel fully mature.
“Runway is still quite early in its journey.”
- Brian L.
Challenging onboarding due to feature depth
Some feedback indicates that the initial setup can be confusing because of the platform’s breadth of features.
It helps with revenue recognition and financial oversight by combining information from accounting, CRM, and banking systems into one source of truth that is always up to date.
This financial software focuses on automating consolidation while keeping existing Excel models. Finance teams can make real-time dashboards for P&L, cash flow, and KPIs, and they can also update reports right away when their data changes.
Users say that it is more flexible and faster to analyze than manual spreadsheets, but they also say that it takes time to learn and that it needs to be updated when source systems change. Datarails is a good choice for teams looking for the best financial dashboard software but don’t want to give up Excel entirely.
What Users Like About Datarails
Centralizing financial data for dashboards and reporting
Users often say that Datarails helps combine data from multiple systems into a single reporting layer for finance dashboards and reports.
“The platform's ability to centralize multiple data sources seaml...thout losing anything.”
–
Stephen C.
Flexible reporting that fits finance team workflows
Some reviewers highlight that dashboards and reports can be tailored to match how finance departments work and what they need to measure.
“Previously, I worked at a company that had not invested in an FP...exactly the way I need.”
–
Joseph L.
Structured financial analysis support during implementation
Users say that Datarails helps finance teams move toward more organized analysis with structured dashboards and reports during onboarding and training.
“We are currently in training mode in our data rails journey. The...ser focused solutions."
–
Greg Q.
What Users Dislike About Datarails
Datarails is used for financial planning and reporting, but some users highlight challenges related to usability, adoption outside finance teams, and technical complexity.
User experience issues in certain dashboard views
Some users report that parts of the dashboard can feel glitchy or behave unexpectedly during use.
“The UX sometimes gets glitchy when utilizing the 'Storyboards' n...s native architecture.”
- Stephen C.
Adoption challenges outside finance teams
Reviewers note that encouraging usage among non-finance stakeholders can require additional effort and change management.
“The only consideration is getting buy-in from your non-finance u...a data warehouse, etc.”
- Joseph L.
Technical complexity in data modeling and logic
Some users say that understanding the underlying logic or coding behind dashboards and reports is sometimes necessary.
“There is an element of coding (and understanding the coding logi... minor but noteworthy.”
- Greg Q.
5. Databox: Financial Dashboards for SaaS KPI Tracking in Real Time
Databox is a financial dashboard program made for SaaS companies that need quick access to performance metrics for their marketing, operations, and revenue.
Price
$159 to $799/month
Ideal use case
Teams and marketing agencies needing to centralize and visualize performance metrics
User Score
4.4 ⭐⭐⭐⭐
It helps keep track of revenue by bringing together data from subscriptions, billing, and pipelines into shared dashboards that automatically update when the source systems do.
Databox aids SaaS businesses that are looking for a quick to implement solution. Without writing any code, teams can connect data from accounting, CRM, and product tools and then make real-time dashboards for KPIs, goals, and forecasts.
User reviews generally say that it's easy to use, it can automatically generate reports, and it has great visualization for people who don't work in finance.
Users also say that advanced modeling and customization have their limits. Databox is a good choice for teams looking for a financial dashboard software for real-time visibility instead of detailed financial planning. On the other hand, teams looking for deeper insights might find it lacking.
What Users Like About Databox
Dashboards that bring financial and performance data together
Users often say Databox makes it easier to track key metrics by consolidating data from multiple tools into a single dashboard view.
“All data sources in one place makes it easy to track everything that matters.”
–
Nancy S.
Simpler recurring reporting processes
Several reviewers say Databox reduces reporting overhead by making it easier to build, maintain, and share regular reports.
“Databox has transformed how we report both internally and externally.”
–
Marc W.
Low learning curve for creating dashboards
Users say dashboard creation is approachable even without prior analytics experience.
“Pretty easy to follow your nose without prior analytics experience.”
–
Rob V.
What Users Dislike About Databox
Databox is commonly used for KPI tracking and dashboards, but some users report limitations related to dashboard flexibility, integration coverage, and advanced customization support.
Limits on dashboard size and visual flexibility
Some users say they run into constraints when building larger or more complex dashboards, particularly around visual limits.
“Limitations on visual (maximum 100) needs more flexibility.”
- Rob V.
Gaps in available integrations
While Databox supports many major tools, some users note that certain integrations are missing despite otherwise broad coverage.
“While it has the major business integrations available, there are some that are missing.”
- Nancy S.
Challenges with advanced dashboard customization and support
A smaller group of reviewers mention difficulties when setting up more advanced dashboards and express frustration with support responsiveness.
“I'm not sure what has happened with the customer support team at Databox but they are fairly unresponsive these days.”
- Alan M.
Conclusions
The best financial dashboard software for your SaaS business will depend on how mature its reporting is, how complex its data is, and how its internal processes work.
Some tools focus on structured revenue reporting and making audits easier, while others focus on forecasting, Excel-based analysis, or quick access to KPIs.
User feedback on these platforms shows that automation and centralized dashboards are always useful, but there are trade-offs like having to learn how to use them, being limited in how much you can customize them, or having to deal with complicated setups.
When looking at financial dashboard software, you need to make sure that the technical depth matches the team's ability to use and keep the system over time.
Co-Founder and CEO at Grid. Ethan has over 10 years of experience in SaaS. He created Grid to help businesses get clear data without having to spend hours wrangling data and writing SQL queries.
More Blog Posts
Your complete guide to revenue intelligence: metrics, AI, platforms, pricing, and how you can choose the right tools.
With Grid, you can skip the manual work and instantly access accurate metrics and actionable insights into every aspect of your business to drive sustainable, profitable growth.