
SaaSGrid is now Grid! Read about our evolution here.
In a previous post, we defined The Pipeline Metrics that Matter to explain the most important sales pipeline metrics to add to your reporting stack. In the past, we’ve also written about The SaaS Metrics that Matter, which provides a helpful overview across all the main categories of SaaS metrics that you should be reporting on. This post expands on these by breaking down the most critical growth-specific metrics to track the performance, health, and scalability of your SaaS business.
Monitoring business growth is critical for refining your expansion strategies, minimizing burn, and building investor trust. Below, we outline the growth metrics every SaaS company should track to identify growth opportunities and optimize their go-to-market strategy. This is why efficiency matters day one.
Annual Recurring Revenue (ARR) is the total annualized value of a subscription. It measures the amount of predictable and recurring revenue you can expect from your current customers over the course of a year.
ARR is calculated as the sum of your subscription revenue across all customers. This amount excludes one-time revenue from professional service add-ons or pilots. If you have 50 customers who bought an annual subscription of $10,000, your ARR would be $500,000. Since ARR always reflects your most recent contracts, the number will change if any contracts go through upsells or downsells.
ARR is a core metric for assessing long-term business health and YoY growth. Flat or declining ARR can indicate issues like poor product-market fit and ineffective customer acquisition. Measuring recurring revenue is also essential for effective budgeting, hiring decisions, and building investor confidence.
Breaking ARR into key components can help you understand movements over time and identify specific areas of your business that drive growth or decline. At any given point, you want to understand the contribution of the following:
Separating and analyzing each ARR component can be time-consuming especially when done manually. A business intelligence tool like Grid calculates each component automatically to help you allocate your customer success and sales resources effectively.

While ARR benchmarks vary by industry and company age, there are some general targets:
Existing customers have higher LTV and require fewer resources to keep than it takes to acquire new customers. If ARR is decreasing, focus on customer retention and increasing expansion revenue. Refine your customer success strategies and introduce more value-based upsell opportunities. You can then prioritize customer acquisition through more targeted marketing spend.
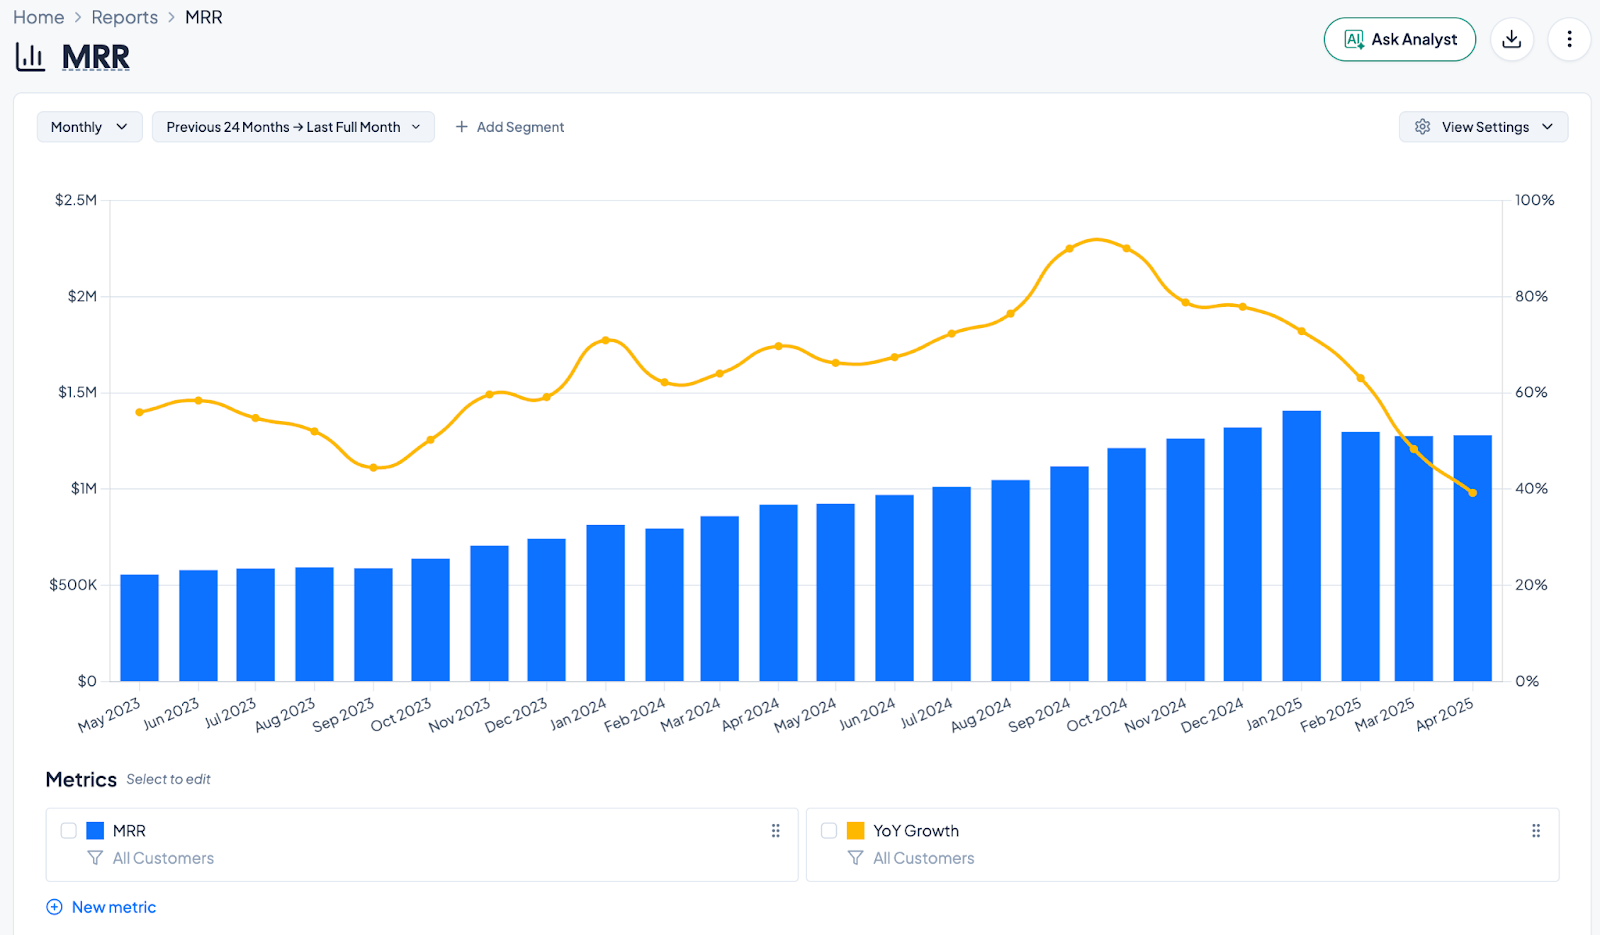
Monthly Recurring Revenue (MRR) is the total monthly value of a subscription. It is often more appropriate than ARR for companies offering month-to-month subscriptions. If you sell both monthly and annual subscriptions, choose the metric that represents the majority of your revenue.
To calculate MRR, sum the value of all subscriptions you’ve sold for a given month. For example, if 100 customers bought a monthly subscription of $10,000, MRR will be $1M. Note that MRR is not always ARR divided by 12 there can be differences from factors like discounts and prepayments.
MRR can be broken down into the same key components as ARR, only calculated on a monthly basis. Monitoring MRR and its movements allows you to spot emerging patterns in recurring revenue faster. For example, you might see an increase in new sales from a specific customer segment. With this information, you can quickly shift more resources to channels that reach this segment, capitalizing on your momentum.
While there are no universal MRR benchmarks across industries and company age, you can consider the same general targets as those for ARR:
To improve MRR, prioritize retention by reaching out to at-risk customers and offering tiered renewal options. Strengthen expansion revenue by timing feature releases with slower growth periods and stabilizing new sales with limited-time discounts.
Customer count is the number of total end customers you serve. These customers can fall into one of three categories:

Strategies like new success programs and targeted expansion campaigns based on use case patterns can help you renew more customers and grow your sales.
Annual Contract Value (ACV) is the average annualized value of all active customer contracts. Like TCV, ACV includes non-recurring revenue, contract expansions, and contractions.
You can calculate ACV from ARR and non-recurring revenue from your active contracts. If you have 10 customers contracted to pay $10,000 ARR for two years, ACV will be 10 * $10,000 = $100,000 since ACV is an annual figure. If five of these 10 customers have paid $2,000 for a one-time service in that same year, you will add 5 * $2,000 = $10,000, yielding a total ACV of $110,000.
ACV shows the revenue a contract generates per year, regardless of its total length. Smaller ACVs are typically driven by SMBs, so you need to adapt your sales and delivery strategy to profitably serve higher volumes. On the other hand, having just a few enterprise accounts yields a larger ACV, so you can direct larger investments to sales and customer success.
Tracking ACV is essential for efficient scale and optimizing unit economics. For example, spotlighting periods of ACV growth can point you to effective sales, marketing, and product strategies to replicate in future sales efforts. Comparing the CAC of new customers to their ACV can also help you ensure customer acquisition costs don’t exceed one year of revenue.

ACV is a direct reflection of your target customer profile. Companies targeting large enterprise clients or industries with higher budgets typically have much higher ACVs than those focusing on SMBs.
Common strategies to boost ACV include launching mid-year upgrades to encourage expansions before renewal, and setting up price increases for renewing existing customers with minimal impact on retention.
Compound Monthly Growth Rate (CMGR) is the average monthly growth over a period. Month-over-month growth rates often appear lumpy due to the irregular nature of components like new sales and churn. CMGR shows the consistent growth rate on a monthly basis, smoothing out spikes and dips to surface underlying trends.
To calculate your CMGR, use a Compound Annual Growth Rate (CAGR) calculator on a monthly basis. If you began the year at $100k ARR and ended at $1M ARR, you would enter those starting and ending values over 12 periods. The result will be a CMGR of 21%.
CMGR reveals accelerations or decelerations in growth momentum, even when metrics like ARR and MRR are still increasing. For example, comparing CMGR before and after implementing new marketing strategies or product overhauls can reveal whether these initiatives drive sustained growth, rather than just temporary bumps in MRR. Tracking CMGR also helps you spot early signs of growth decline and implement corrective measures before ARR decreases.
Startups seeking Series A or B funding should aim for a CMGR of at least 15% if their ARR is below $1M ARR and 10% if ARR is above $1M. A CMGR of 10% is about 3x year-over-year growth.
Reducing churn and optimizing your user acquisition efforts can grow CMGR. Incentivizing annual contracts through exclusive features and priority support directly increases MRR and CMGR. Refine your marketing messaging and sales targeting to attract more prospects likely to retain longer and upgrade.
Customer Concentration is a measure of the distribution of recurring revenue within a company’s customer base. It helps you evaluate if growth is driven by a few big contracts or many small ones.
For each customer, the cumulative percent of customers (from largest to smallest) and the recurring revenue they represent are graphed on a chart. If you have 20 customers and $500 in revenue, where the largest customer produces $100 per month in revenue, 5% of your customers (1/20) produce 20% of revenue (100/500).
Knowing how recurring revenue is distributed across your customer base is essential to mitigating business risk. Concentrating too much revenue in too few large accounts can make you overly dependent on these customers for sustained growth. On the other hand, if the largest customer is less than 10% of revenue, that indicates low customer concentration.

To balance out your revenue distribution, focus on acquiring customers across new market segments, targeting different industries, or developing additional offerings to appeal to a wider audience.
Your growth metrics are the best indicators of product-market fit and business health. They build confidence with investors and provide performance insights into your product, sales, and operations.
Yet, tracking these metrics downloading, reconciling, and analyzing data from siloed systems is complex and inefficient. The most effective way to do it is to use a centralized platform that calculates them for you.
Built specifically for SaaS businesses, Grid automatically generates consistent, accurate growth metrics, so you can make informed, growth-generating decisions:
With Grid, leading SaaS companies like Scratchpad, Vizion, and Branching Minds have real-time ARR, MRR, and TCV insights at their fingertips. This comprehensive visibility has unlocked substantial operational efficiencies:
If you want real-time performance insights but manual data analysis is slowing you down, Grid can help. Book a demo today to discover what segments, products, and industries drive your growth.


A practical look at five SaaS automation tools, comparing real user feedback on workflows, limits, and fit.

Compare five SaaS analytics tools and see how each supports revenue, product insights, and decision making.

In this guide, Chris breaks down the four metrics that help businesses optimize their performance, attract investor confidence during their next funding round, and position themselves for scale.


