
SaaSGrid is now Grid! Read about our evolution here.
Revenue forecasting is the process of figuring out how much money your business will make over a certain amount of time, usually monthly, quarterly, or yearly.
You come up with that estimate by looking at how well you've done in the past, how many sales you have in the pipeline right now, and what's going on in the market.
Forecasting isn't just about making a number for a board deck for founders and finance leaders. It helps guide almost every important decision your business makes.
Your forecast shapes your budget. If you expect revenue to grow by 25 percent next year, you may decide to:
If growth slows, you may pause hiring or reduce discretionary spending. A forecast gives structure to those choices.
When it comes to fundraising, forecasts are just as important for private SaaS startups. Investors look at both past performance and future revenue projections. They want to make sure that what the leaders say is backed up by the data.
If a public company misses its revenue guidance, its stock price can drop quickly. Investors look at what leadership said would happen and what actually happened. Trust goes down if you fail to meet forecasts over and over.
Forecasts also help you keep your risks in check. You can make changes early if you think churn will go up or pipeline conversion will slow down.
For example:
Forecasting gives you and the leaders time to act before problems get too serious.
As a high-level leader must be able to distinguish between three distinct terms often used interchangeably:
SaaS revenue forecasting is different from traditional sales forecasting because most of the revenue comes from contracts and subscriptions, not one-time purchases.
That means that forecasts need to take into account not only new deals but also revenue from current customers, renewals, churn, and growth.
Most SaaS companies use more than one method to make better guesses about how much money they will make in the future. Here are three common approaches used in SaaS
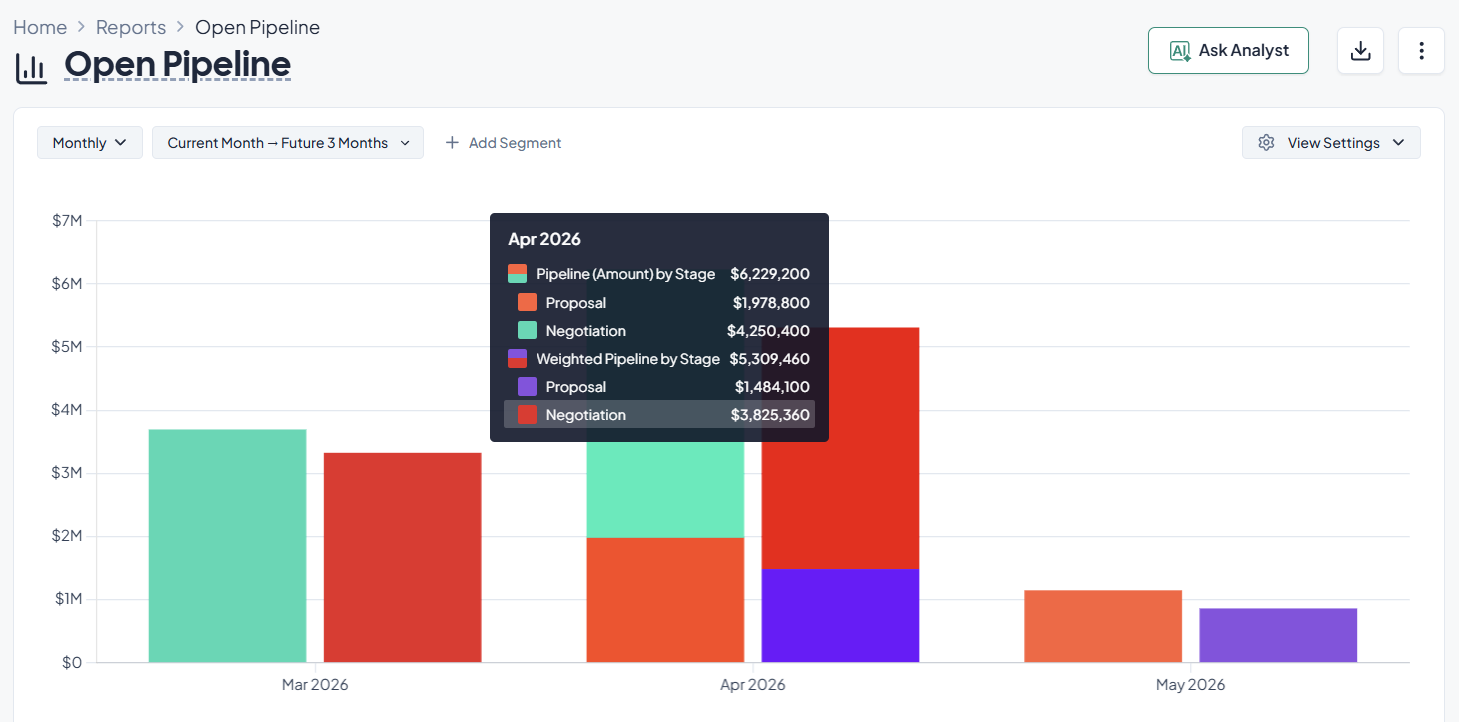
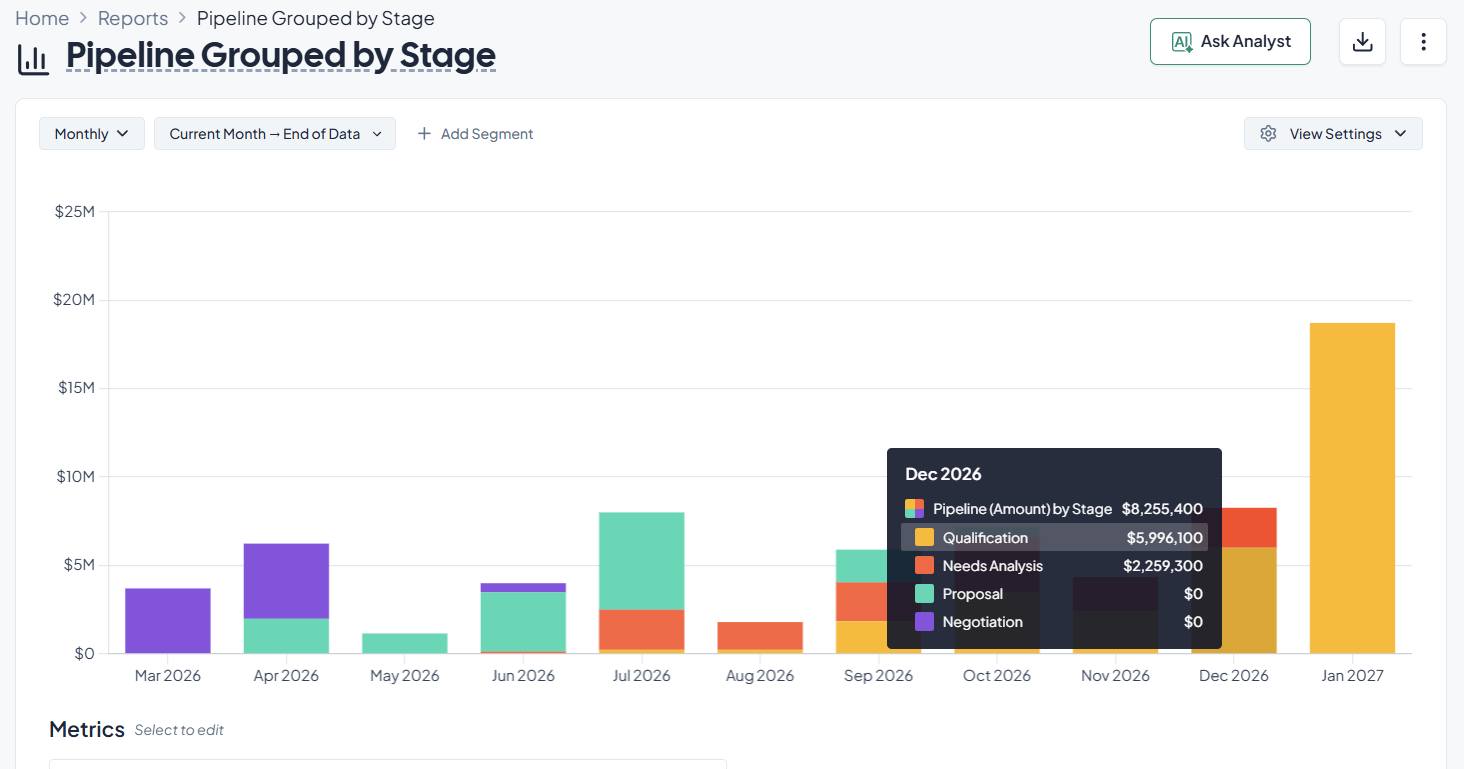
Pipeline forecasting looks at active sales opportunities and uses probabilities based on stage to guess how much money will come in in the future.
A rough probability of closing is given to each stage in the pipeline. To find the expected revenue, you multiply the deal value by that probability.
For example:
Total forecast from these deals = $102,000 expected revenue
This method helps sales teams guess how much money they’ll make in the near future and keep an eye on the health of their pipeline.
Be mindful that the accuracy of pipeline forecasting depends on clear stage definitions and correct deal updates. The forecast gets too optimistic if deals move stages too quickly.
Grid allows your team to quickly slice and segment pipeline data, keep an eye on win-rate trends, and predict revenue based on how the pipeline is actually performing without having to rebuild spreadsheets or export CSV files.
Backlog forecasting focuses on revenue that has already been contracted but not yet recognized. It’s common in SaaS companies where customers sign annual or multi-year agreements.
Instead of predicting whether a deal will close, backlog forecasting predicts when the revenue will appear.
For example, let’s say a SaaS company signs three annual contracts:
Using backlog forecasting, the company can now estimate how much revenue will appear each month as contracts activate.
This method helps finance and leadership teams:
For SaaS companies with implementation periods, delayed start dates, or usage ramp-ups, backlog forecasting is very important.
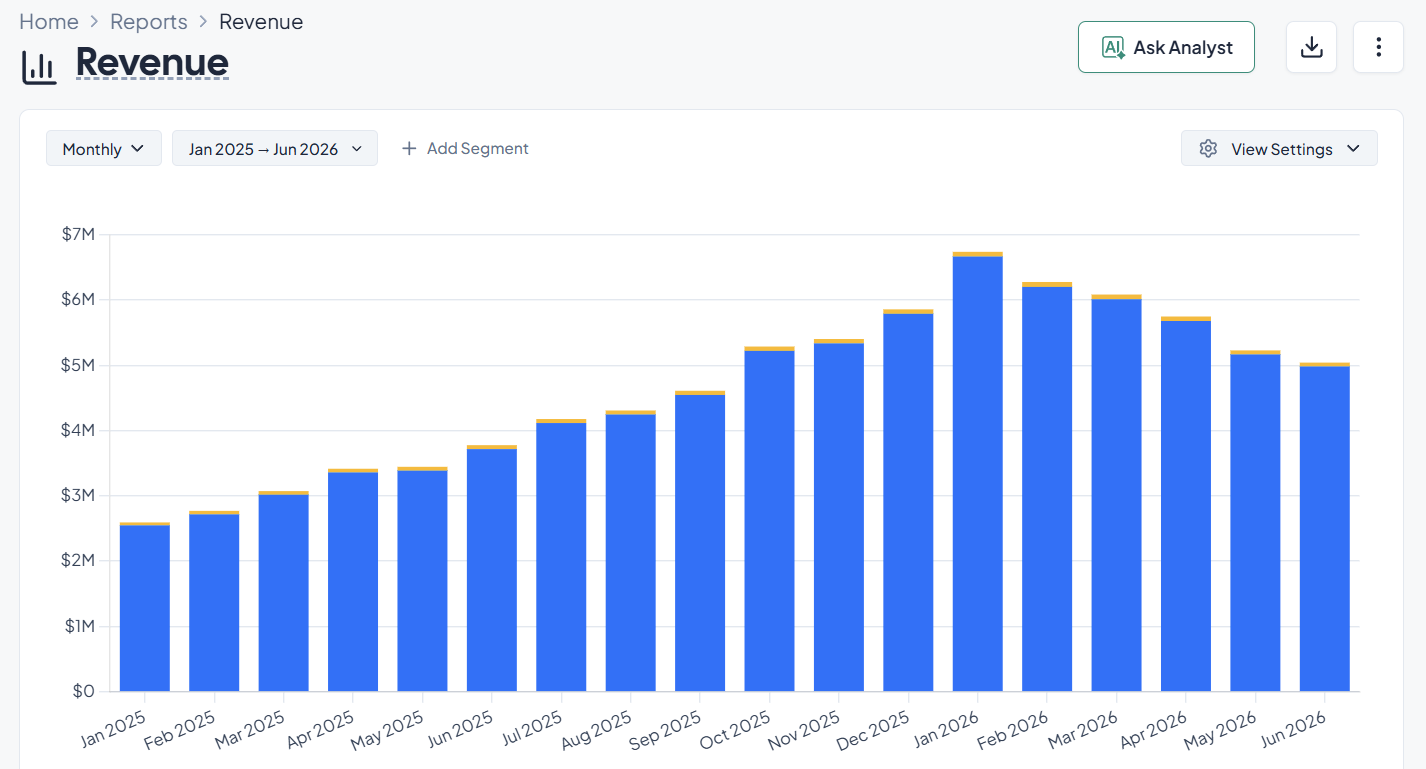
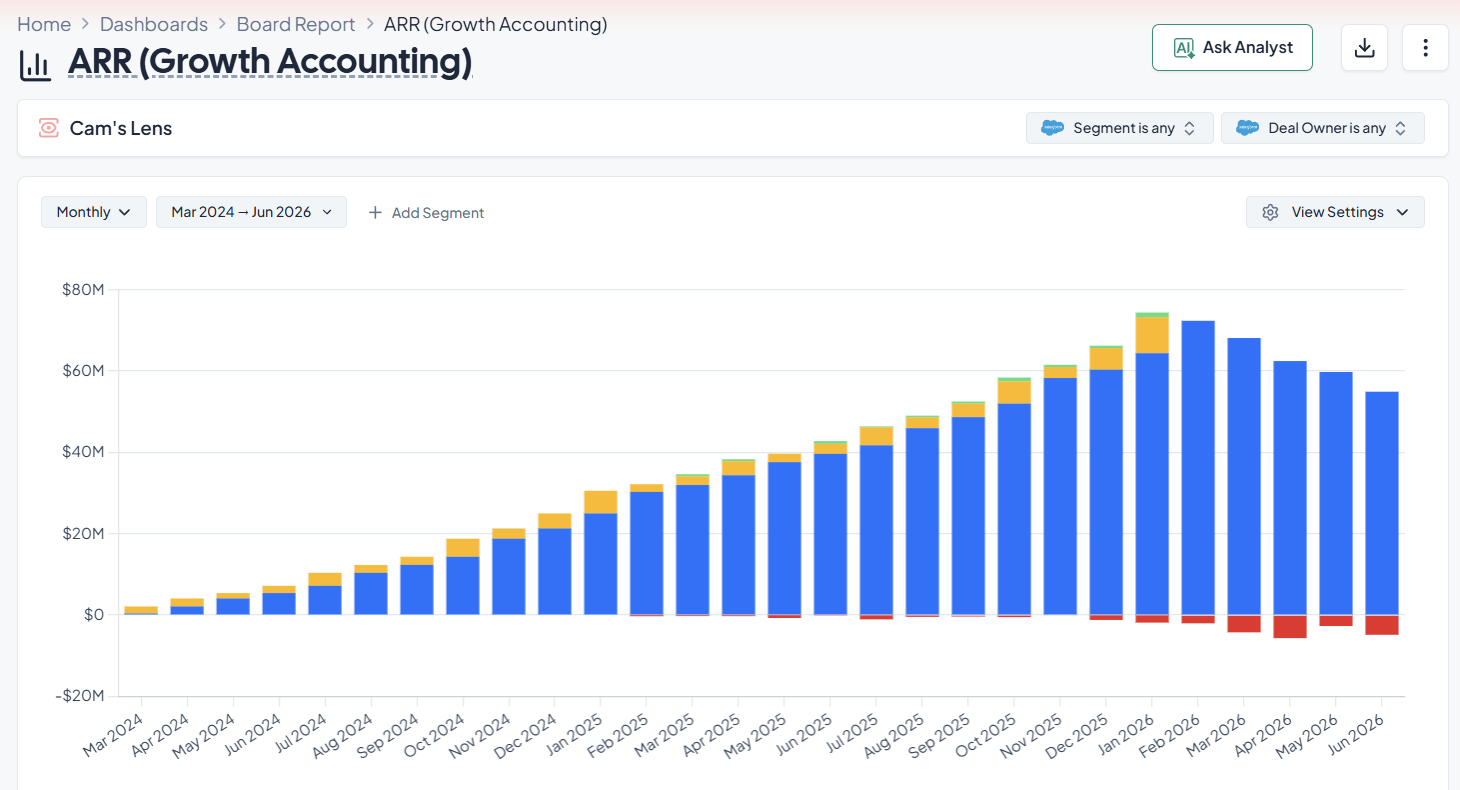
Another common way to predict SaaS revenue is to start with existing recurring revenue and change it based on past patterns.
This method doesn't try to guess every single deal; instead, it assumes that a part of future revenue can be guessed based on the current customer base.
This model typically uses:
For example, a SaaS company begins the quarter with:
Forecast calculation:
Starting ARR: $5,000,000
Churn impact: -$250,000
Expansion impact: +$500,000
Baseline forecast ARR = $5,250,000, before adding new pipeline revenue.
This method is widely used in SaaS because existing customer revenue often makes up the majority of total revenue.
Tools like Grid help teams analyze this by tracking ARR, churn, and expansion trends, allowing finance and RevOps teams to forecast growth based on historical performance instead of rebuilding models manually.
Modern forecasting tools increasingly rely on AI to speed up analysis and reduce manual work.
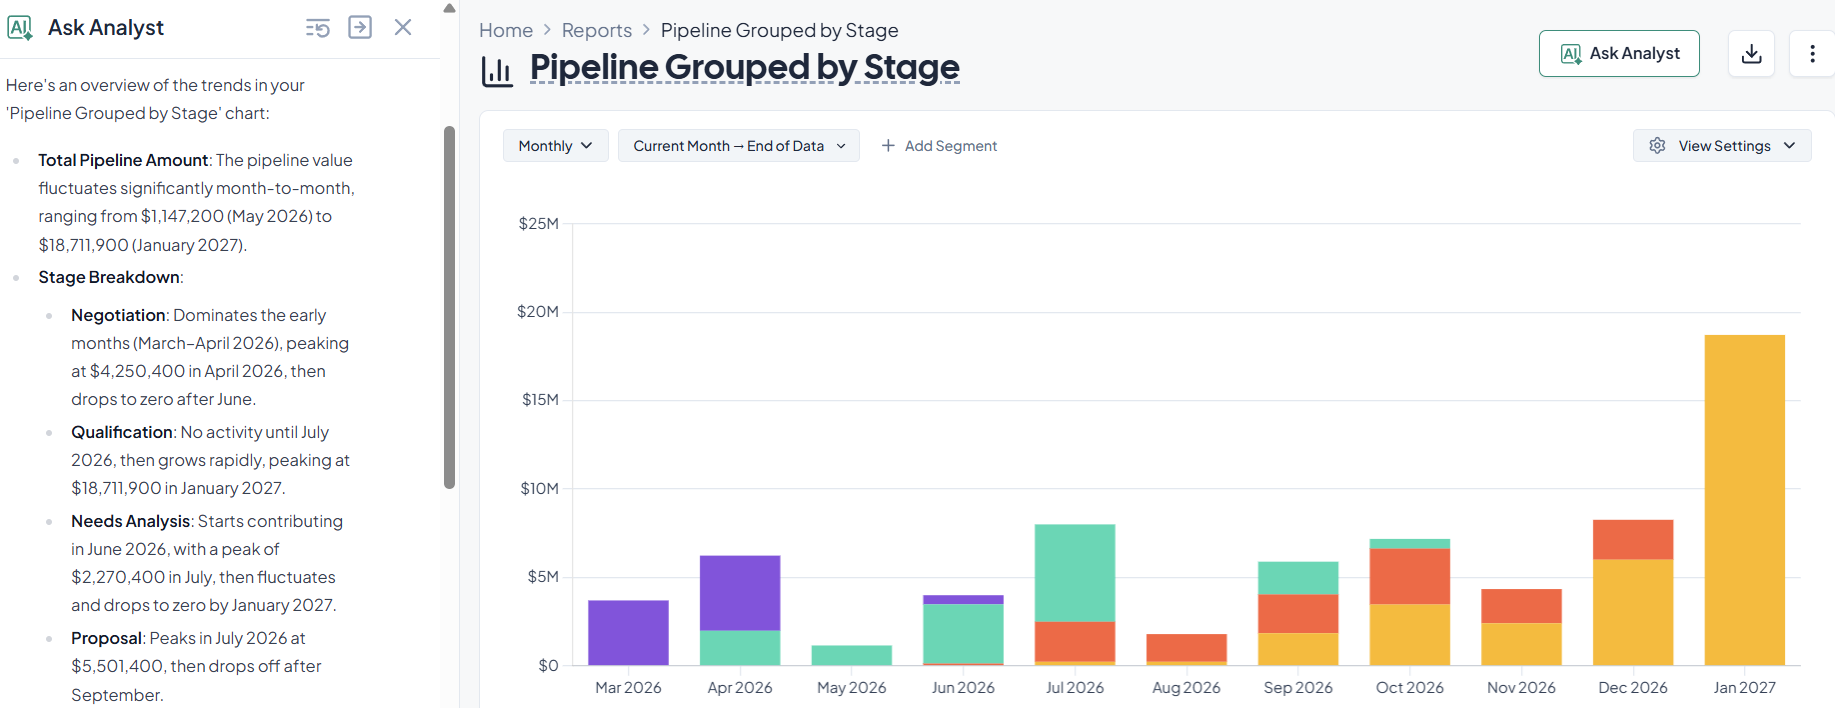
For instance, Grid's AI Analyst lets teams ask questions about pipeline, ARR, churn, or segments and get charts or reports right away. Teams can quickly look at revenue trends, analyze pipeline performance, and test forecast assumptions without having to export CSV files or rebuild spreadsheet models.
This is especially useful when teams need to answer questions like:
Since the analysis uses data from both CRM and finance, it's easier and faster to make predictions for sales, finance, and leadership teams.
In practice, SaaS companies combine all three approaches:
We can add up the forecast from all 3 methods to make a more accurate revenue projection.
There are many different ways to approach revenue forecasting. To maximize accuracy, leaders should always utilize a blended approach, combining multiple models.
A revenue forecast represents the most likely outcome based on data. It combines:
These forecasts look to describe what’s expected to happen.
If we want to grow faster than the market, what revenue target should we set across the company?
Top-down forecasting starts with a market view. Leadership might begin with:
From there, they allocate revenue targets to business units or regions.
If the SaaS market is growing at 15 percent and your current revenue is $20 million, leadership might set a 20 percent growth target to gain share. That target is then divided across sales teams.
Let’s say:
Now that we have a goal we should be asking ourselves:
So let’s check sales capacity, if:
If your company only has:
The goals are unattainable unless you hire more reps for the Enterprise and Mid-Market teams. This shows that there is a gap between what you want to do strategically and what you can do in practice.
Based on our current pipeline and sales capacity, how much revenue can we realistically deliver?
Bottom-up forecasting starts with execution data. Instead of beginning with market size or growth targets, leadership looks at:
From there, they calculate expected revenue based on what the sales team can realistically close.
Instead of starting with a 20 percent growth goal, leadership reviews current pipeline and rep productivity.
Let’s say:
Revenue is then distributed across segments based on actual pipeline data.
Projected total revenue:
Now that we have a forecast, we should be asking ourselves:
So let’s validate our sales capacity, if:
If your company has:
Then the forecast is aligned with execution capacity. If rep count is lower, revenue will likely fall short unless hiring increases.
This approach reflects execution reality. It may underestimate market opportunities if too conservative.
These models rely on historical data and statistical techniques. You’ll usually rely on lengthy historical data and software to run these models.
If our historical growth rate continues, what will revenue look like next year?
This method assumes growth continues at the same rate year after year. You’ll use it when revenue has grown steadily and leadership expects similar conditions to continue.
Since revenue grew from $16M to $20M, we got 25% growth. So applying 25% again:
$20,000,000 × 1.25 = $25,000,000 is is our expected growth for 2027
Keep in mind:
This method is simple and easy to explain. It becomes risky if last year’s growth was unusual or growth has varied widely across time.
How will seasonal patterns and recurring trends affect revenue in each quarter?
The time series analysis tries to find patterns over time, including seasonality and recurring spikes.
This method is used when revenue shows clear seasonal patterns or recurring trends over time.
Let’s assume this was our quarterly revenue over two the last 2 years:
Comparing quarters side by side we can see:
The model keeps the Q4 spike instead of evenly spreading the $21M across all four quarters.
If the total expected yearly income is $22 million, time series would give more to Q4 and less to Q3.
This method picks up on timing patterns that straight-line growth misses.
If we increase spending, how much incremental revenue can we expect?
This method models the relationship between revenue and a driver, such as marketing spend. It should be used when revenue is closely tied to measurable drivers like:
For example:
Pattern observed: Revenue is roughly 4× marketing spend.
If leadership plans to increase marketing spend to $2,500,000:
We can expect a revenue increase:
$2,500,000 × 4 = $10,000,000
Now we know revenue scales with a measurable driver.
Leaders can test different spend scenarios but the relationship must be validated over time.
Given uncertainty in close rates and deal size, what range of revenue outcomes should we prepare for?
This simulation generates a range of possible outcomes instead of a single forecast.
If our current recurring revenue baseline is $20,000,000 and close rate may vary between 30% and 50%
This analysis shows us:
Monte Carlo focuses on uncertainty, not precision.
Qualitative models depend on experience, expert opinion, and knowledge of the market, not just numbers.
They are helpful when there isn't much historical data, when entering new markets, or when launching new products that don't fit with past trends.

If we are launching a new product category with no historical data, what revenue can we realistically expect in year one?
This method relies on the expertise of the C-suite or founder, especially when historical data isn’t available. It’s valuable for new businesses or when introducing an entirely new product.
Let’s say you’re launching a new AI add-on product to your existing SaaS.
Since there is no historical data. Your team uses:
So now you and the leadership estimate:
Projected revenue:
200 × 25% × $15,000 = $750,000
Now you have an initial forecast to guide hiring, marketing, and budget decisions.
This method depends heavily on judgment. It works best when experienced leaders understand the market and similar past launches.
But remember, you should always validate later against real performance data.
When experts disagree about growth expectations, what revenue estimate reflects a balanced consensus?
The Delphi method gets predictions from a group of experts through structured rounds. Each expert sends in an estimate without giving their name. They change their predictions after looking at the group's results. The process goes on until everyone agrees on a stable point of view.
This method requires many experts providing inputs, small startups or new companies don’t always have access to enough resources to apply it accurately. It’s used when:
For example:
A company plans to expand into a new vertical market.
Five industry experts provide first-round revenue estimates for Year 1:
Average initial estimate: $2,800,000
After reviewing the group’s reasoning, experts revise their numbers:
New consensus range: $2,500,000 to $3,200,000
Average revised estimate: $2,780,000
Now you have a more balanced forecast based on structured expert input.
It’s important to note that this method doesn’t replace quantitative models. It complements them when data alone cannot provide reliable answers.
To make an accurate revenue forecast, you need to combine good data with real-world experience.
That means going beyond just looking at the total number of leads and taking into account how sales teams really work, how customers act, and how outside factors might affect demand.
Forecasts work best when finance, sales, and leadership all give their input and when the model is updated regularly with new data.
Follow these simple but important practices to improve your forecasting:
A lot of businesses fail because they use manual spreadsheets, which are easy to make mistakes with, hard to keep track of changes, and don't allow for real-time collaboration.
Some common strategic errors are:
These issues are common in revenue forecasting, but most can be reduced with clearer processes, better data practices, and simpler models.
When you do spreadsheets by hand, problems with version control are inevitable, making it hard to see changes over time. One way to fix this is to link forecasting to systems that already keep track of revenue, like CRM and accounting platforms.
Grid can help by combining data from different systems into one view and automatically updating metrics like ARR, pipeline, and churn.
This gets rid of the need to manually merge CSV files and keeps forecasts in line with the most recent data.
It's helpful to look at historical data, but forecasts should also take into account what's happening now. Teams can make better predictions by regularly looking at both outside signals and their own capacity.
For instance, if hiring new sales reps slows down or a key market segment weakens, those things should be taken into account when making the forecast.
Many teams deal with this by holding quarterly reviews of their forecasts that include data from the pipeline and input from sales, finance, and marketing leaders.
Forecast models should look at the factors that really affect revenue. In SaaS, this usually includes the value of the pipeline, the win rate, the average deal size, the length of the sales cycle, churn, and growth.
Adding too many related variables can make it hard to keep forecasts accurate and make it hard for stakeholders to trust them.
It is best to start with a core model that has only a few metrics and then look at other factors separately instead of putting them all into the forecast.
Sales reps can give important information about how deals are going, but their predictions should be compared to actual historical performance. Managers can and should use both probability models and the judgment of their reps to find a balance between being realistic and being hopeful.
For instance, if deals in the proposal stage have a 40% closing rate in the past, forecasts should show that average unless there is clear evidence that a specific deal is different. This is where proposal autonomation tools add real value, since they can flag when a rep's stage-by-stage progress lines up with historical norms, making it easier to spot deals that genuinely warrant extra optimism or caution.
CRM dashboards and revenue analytics tools can help confirm rep predictions by showing how often deals move from one stage to the next and how the pipeline changes over time.
Companies are changing how they make predictions thanks to modern RevOps platforms and AI tools.
While forecasts used to depend a lot on spreadsheets, rep judgment, and fixed models. Today, a lot of teams use AI-assisted insights, automated data collection, and historical performance analysis to make forecasts that are more reliable and easier to change when things change.
AI systems help teams quickly look at a lot of revenue data and find patterns that would be hard to find by hand. These tools can look at things like changes in the deal stage, past win rates, sales cycle trends, and customer behavior to guess what will happen next.
Tools like Grid approach the problem from a RevOps and finance perspective.
Grid’s AI Analyst allows teams to explore revenue data by asking questions in plain language and instantly generating charts or reports. Instead of manually rebuilding models every time a new question arises, teams can quickly analyze pipeline, ARR, churn, or segment performance and use that analysis to inform forecasting decisions.
This makes it easier to test assumptions and understand why forecasts change over time.
To make accurate predictions, you need to have a full and consistent picture of your revenue data. For a lot of businesses, this information is stored in different tools, such as CRM systems, marketing platforms, billing systems, and accounting software. When data is split up, you often have to export CSV files and combine them by hand, which makes mistakes and slows down analysis.
RevOps platforms try to fix this by linking these systems together so that there is only one source of truth. When marketing, customer revenue, and pipeline activity data are combined, leaders can see the whole process from getting leads to closing sales.
For instance, teams can look at pipeline performance along with recurring revenue metrics like ARR, churn, and expansion when CRM and finance systems are linked through a platform like Grid. This unified view helps us answer real-world questions like:
Modern RevOps platforms use AI-assisted analysis and unified data to make predictions less reliant on manual models and more based on how deals, customers, and revenue streams actually behave.
SaaS companies can plan their hiring, spending, and growth based on what is most likely to happen by using revenue forecasting. By looking at the pipeline, recurring revenue trends, and contracted backlog, teams can tell the difference between revenue that will come in and revenue that will come in only if new deals are made.
Clean data, simple models, and regular reviews are also important for making accurate predictions. When CRM, finance, and pipeline data are linked through revenue analytics platforms like Grid, teams can spot risks earlier, analyze trends faster, and make changes to their plans with more confidence.


Explore Stripe alternatives and find the right fit for billing, payments, and finance workflows as complexity grows.

Grid and traditional Financial Planning and Analysis (FP&A) platforms each offer powerful reporting capabilities and operational clarity for growing SaaS companies.

Your complete guide to revenue intelligence: metrics, AI, platforms, pricing, and how you can choose the right tools.

With Grid, you can skip the manual work and instantly access accurate metrics and actionable insights into every aspect of your business to drive sustainable, profitable growth.

