How to Vet SaaS Reporting Tools (and the 5 Best Solutions for 2026)
We’ve outlined five key criteria that separate truly scalable reporting platforms from tools you’ll outgrow in 12 months.
By Ethan Ruby, Grid Co-Founder and CEO
At first SaaS metrics look simple, it's common for small teams to use simple dashboards and spreadsheets to keep track of their revenue and pipeline.
But this manual, disconnected method doesn't hold up as your business grows. Metrics spread out across systems make it so finance, and RevOps take hours to reconcile numbers, slowing down decisions and making board reporting a long and error-prone nightmare.
Metrics live in different systems. Stripe tracks billing, Salesforce tracks pipeline,
and finance teams rely on spreadsheets.
Teams spend hours reconciling numbers. Metrics don’t match, decisions lag reality,
and board reporting becomes manual and stressful.
A SaaS reporting platform connects revenue, sales, and finance into a single source
of truth, delivering trusted insights in real time.
The Issues With Multiple Systems
As B2B SaaS companies grow, their reporting needs evolve. Early on, teams get by with a patchwork of spreadsheets and ad-hoc exports from QuickBooks or CRM tools. But as new revenue streams and greater complexity emerge, this approach breaks down.
Hours are wasted reconciling numbers, board meetings rely on manual updates, and real insights are delayed. The result? Slower decisions, missed opportunities, and growing frustration for everyone from RevOps to founders.
A reporting tool that only handles subscription metrics quickly becomes a bottleneck. Only a platform built to scale with the business unlocks true operational intelligence.
Why You Need a SaaS Reporting Tool That Scales
Manual reporting breaks down as soon as revenue volume, pipeline complexity,
and team size start to grow.
Disconnected systems slow decision-making and often turn board reporting
into a last-minute scramble.
Dedicated SaaS reporting platforms unify revenue, sales, and finance data
into a single source of truth.
Not all tools scale effectively. Many are billing-first or dashboard-only,
which limits their usefulness as complexity increases.
This guide evaluates SaaS reporting tools using five criteria that matter
over the long term, not just at early stages.
By the end, you’ll understand which platforms fit your current growth stage
and why others may fall short as you scale.
The evolution of reporting needs
In the early stages, billing metrics like MRR and churn are enough to track growth. But as your business matures, decision-making depends on a broader view: pipeline performance, CAC data, retention trends, and multi-channel revenue streams.
Without connecting insights from CRM, billing, and finance systems, you can end up faceing blind spots in understanding the true revenue picture.
Works only while volume and complexity are low. Data lives in silos, and metrics
are defined inconsistently across teams.
Consistent metric definitions and a single source of truth as revenue and customers increase
Growth Stage
Pipeline performance, CAC, retention by segment, expansion vs churn
CRM + billing + finance tools stitched together in spreadsheets
Manual reconciliation slows decisions. Reports lag reality. Teams debate numbers
instead of acting on them.
Automated data integration, segmentation, and repeatable reporting workflows
Scale Stage
Cohort analysis, multi-channel revenue, forecasting, unit economics
Purpose-built SaaS reporting platforms with automation and modeling
Static dashboards and spreadsheet-based models cannot handle volume, complexity,
or performance expectations.
Real-time insights, flexible analytics, forecasting, and enterprise-grade performance at scale
Integration requirements increase with scale
Early-stage SaaS teams often manage with siloed dashboards in their CRM and accounting software. This works when decisions only rely on a few basic metrics. As the company grows, those metrics need to flow together: revenue data must connect to pipeline activity, marketing attribution, and expense data to reveal true profitability.
Without seamless integrations, teams spend hours reconciling reports manually, slowing leadership’s access to the insights they need to act quickly.
Growth drives advanced reporting requirements
Static dashboards and monthly reports may work at the beginning, but growing SaaS companies eventually need advanced capabilities like segmentation, cohort analysis, and custom metric creation to surface meaningful insights.
Reporting tools that can’t handle multi-channel revenue, complex sales funnels, or enterprise-grade requirements become barriers to scaling, limiting a company’s ability to reach its next growth stage.
High-growth SaaS companies need a reporting platform that not only meets today’s needs but also evolves with tomorrow’s. A solution that grows alongside the business avoids costly migrations, accelerates decision-making, and ensures reporting always supports strategic goals.
Key criteria for vetting SaaS reporting tools
Recognizing where basic tools fall short is just the beginning. The next step involves identifying a reporting platform that supports strategic decisions and scales alongside your growth.
Evaluation Criterion
Questions to Ask
Signals of a Future Bottleneck
Signals of Long-Term Fit
Example Metrics & Formulas
Data Integration
Does the tool natively connect to our CRM, billing, and accounting systems?
Can it handle multiple revenue sources and entities?
Most teams evaluate SaaS reporting tools based on features alone, but successful SaaS companies evaluate platforms across key criteria that directly impact long-term growth and operational agility.
These teams look beyond surface-level features and focus on five strategic criteria that shape lasting success: seamless data integration, robust automation, deep customization, built-in scalability, and time to actionable insights.
1. Data integration
Data integration is the foundation. A strong reporting platform unifies data from your CRM, billing system, and finance tools into a single source of truth. Centralizing revenue and operational data eliminates manual reconciliation, saving hours of team time. It also enables automation by ensuring all systems stay updated without manual effort.
2. Automation
A reporting platform that automatically syncs and updates metrics ensures everyone is working from current, accurate data without the delays of manual compilation. This frees RevOps from repetitive tasks and accelerates board preparation, making customization practical, as teams can trust their data is fresh and complete.
3. Customization and flexible analytics
High-growth SaaS teams with customizable dashboards can segment by any attribute and create metrics tailored to their unique GTM strategy and KPIs. This ensures dashboards reflect the metrics that actually drive the business, empowering teams and stakeholders to uncover growth levers and surface investor-ready insights.
But these insights are only valuable if they’re fast and reliable. Here's where scalability comes in.
4. Scalability
A reporting tool scales seamlessly alongside your business. As data volume, team size, and reporting requirements grow, the right platform maintains fast performance and reliable dashboards without costly workarounds or migrations.
Enterprise-grade scalability also ensures your reporting infrastructure supports new lines of business, additional users, and evolving compliance needs without disruption all while keeping time to insight short, no matter how complex data becomes.
5. Time to insights
Speed to insight is a competitive advantage. The right SaaS reporting tool turns complex, multi-source data into actionable insights in minutes instead of days. Faster access to clear trends and profitability drivers helps leadership make timely decisions, accelerate growth initiatives, and capture opportunities before they pass.
By evaluating platforms against these five criteria, B2B SaaS teams can confidently shortlist solutions that align with their current and future needs. Platforms meeting these criteria don’t just deliver better reporting they transform disconnected data into a strategic engine for growth, enabling faster decisions, deeper insights, and a more scalable business.
Our favorite SaaS reporting tools for high-growth B2B companies
These five platforms are the most used for SaaS reporting, but they vary significantly in how they support strategic decision-making.
Tool
Best For
Strengths
Limitations
Pricing
User Score
GridTop Pick
SaaS companies with >1M ARR needing centralized SaaS reporting
Standardized reporting for ARR, MRR, churn, and retention
Automated dashboards that replace spreadsheets
Unified reporting across finance, product, and operations
Prebuilt reports with near real-time data updates
Advanced reporting depth can require onboarding time
Less flexibility for non-standard data inputs
Free to Custom Pricing
4.6
Maxio
Early-stage and mid-sized SaaS finance teams
Automated revenue schedules and deferred revenue reporting
Strong alignment with accounting and billing workflows
Clear visibility into MRR, ARR, and revenue waterfalls
Reporting customization is limited
User interface can be difficult for new users
Advanced analysis often requires exporting data
$599/month to Custom Pricing
4.4
ChartMogul
B2B SaaS teams needing fast subscription reporting
Preconfigured SaaS metrics like MRR, ARR, and churn
Quick onboarding with billing system integrations
Clear cohort and trend analysis for recurring revenue
Limited flexibility for complex billing edge cases
Pricing increases as ARR grows
Reporting depth is narrower than full BI tools
Start for free and scales with ARR
4.6
ProfitWell Metrics
Subscription businesses focused on recurring revenue insights
Automated reporting for MRR, churn, ARPU, and retention
Direct integrations with major billing platforms
Benchmarking against other subscription companies
Limited customization and export options
Handles complex billing scenarios less effectively
Comprehensive coverage of SaaS metrics like MRR and LTV
Strong visibility into churn and cancellations
Fast setup with payment processor integrations
Pricing can increase quickly as usage grows
Less flexible for non-subscription revenue models
Focused on reporting rather than broader analytics
$49 to $749/month
4.6
Next, we’ll examine each tool in detail to see where they excel or fall short in powering growth-stage B2B SaaS teams.
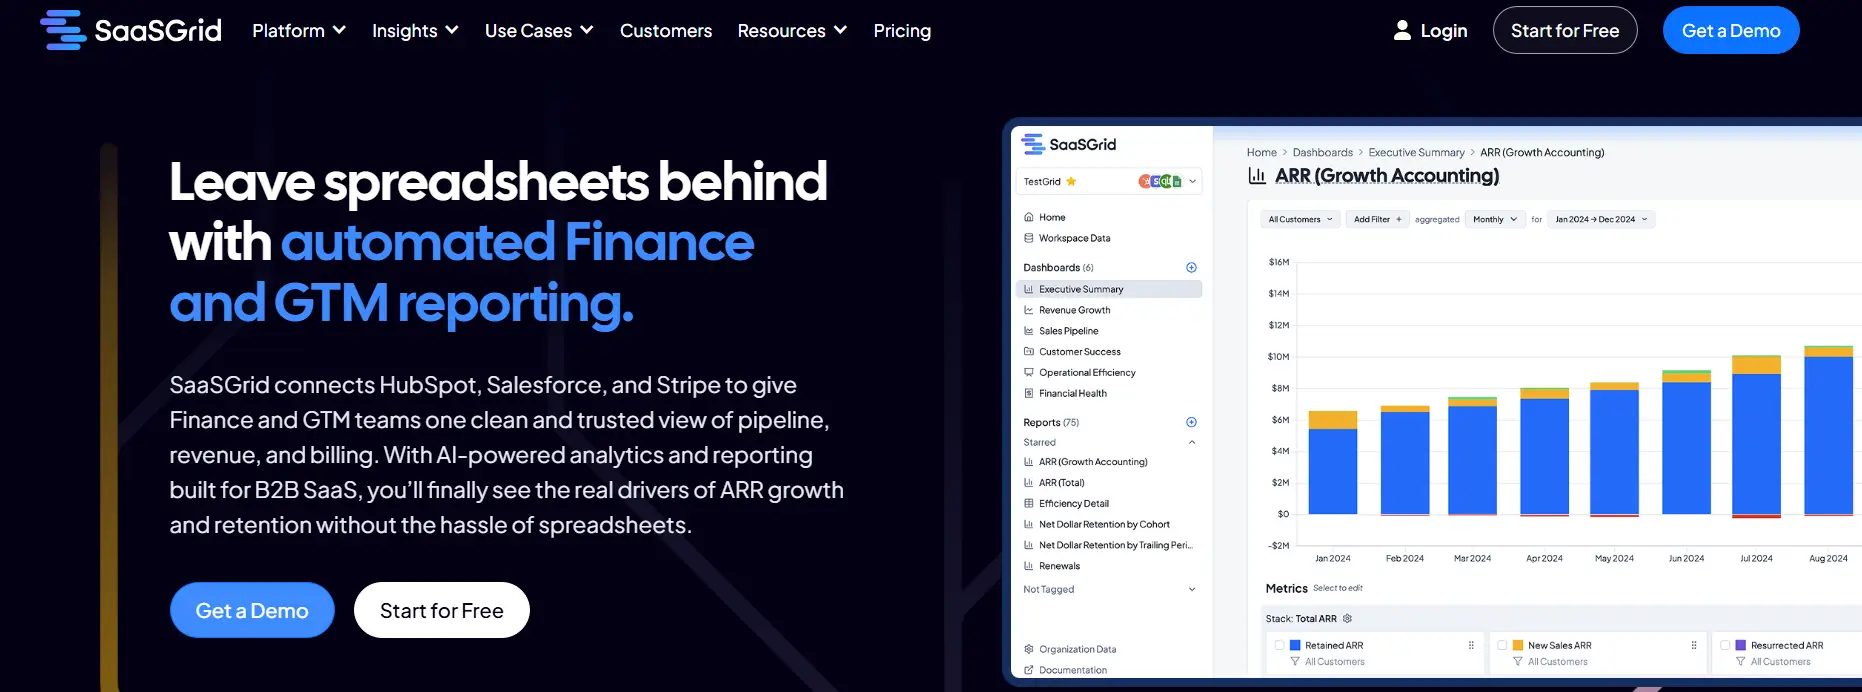
1. Grid: SaaS Reporting and Analytics for Subscription Businesses
Grid is a SaaS reporting tool that helps subscription based businesses keep track of their KPIs, finances and important metrics like MRR, ARR, churn, and retention in a consistent and centralized way.
Grid is a SaaS reporting tool that connects billing, CRM, and financial systems to bring all the data together in a single place.It also makes revenue reporting for your team clear across finance, product, and operations by giving everyone the same definitions and dashboards.
Users often talk about how useful it is to have automated dashboards that update on their own, replacing spreadsheets and making it easier to reconcile.
Everyone can see trends and performance in real time thanks to prebuilt reports and integrations. This structure helps you cut down on time spent preparing data by hand and lets you get insights and make decisions faster, while making sure that all your different systems work together.
The reporting layer of Grid makes sure that everyone in your team is working with the same numbers for revenue and performance.
What Users Like About Grid for SaaS Reporting and Metrics
Custom reporting for SaaS metrics and revenue analysis
Users say Grid makes it easier to track and analyze SaaS-specific metrics like recurring revenue, churn, and performance trends without needing additional BI work.
“Grid has completely transformed how we track and analyze our SaaS metrics, making everything accessible through an intuitive, user-friendly interface.”
–
Verified User in Computer Software
Prebuilt reports that speed up access to insights
Several users point out that prebuilt charts and reports reduce the time required to produce recurring SaaS reports, which is especially useful for finance and revenue teams.
“The most useful reports and charts prebuilt and easily integrated, the time to value is incredibly quick.”
–
Dev D.
Clear visibility into recurring revenue and performance over time
Users say Grid provides a clear view of recurring revenue trends, supporting ongoing ARR and churn analysis without relying on spreadsheets.
“We've been customers of Grid for years now, and we'll keep being customers because it's been amazing to see how far the product has come since then.”
–
Grant C.
2. Maxio: SaaS Reporting and Financial Insight Tool
Maxio is a billing and revenue management platform designed to help SaaS companies manage subscription billing, revenue recognition, and compliance. It’s a strong option for managing recurring revenue operations, but its approach is primarily billing-first.
Maxio was made to support SaaS reporting by automating revenue schedules, deferred revenue tracking, and billing recognition so teams can produce consistent performance reports without wasting time on manual reconciliation.
The goal is to improve the way businesses see recurring revenue trends and financial outcomes over time. As a SaaS reporting solution, Maxio takes contract and billing data to generate accurate revenue and billing reports, showing deferred revenue, ARR, and revenue waterfalls.
In reviews, Maxio’s users mention its ability to align reporting with accounting standards, reducing complexity in close cycles and forecasting tasks as a big positive. Its automated recognition and reporting workflows also allow finance teams to move away from spreadsheets and reduce any errors tied to manual calculations.
What Users Like About Maxio for SaaS Reporting and Metrics
Clear visibility into MRR and recurring revenue performance
Users say Maxio presents MRR and related metrics in a way that makes recurring revenue trends easier to analyze.
“I appreciate the section that displays MRR and other key metrics because it provides insights.”
–
Jennifer M.
Strong alignment with financial systems and revenue workflows
Reviewers say Maxio fits well into accounting workflows, supporting accurate ARR and churn reporting across systems, which is especially important for finance-led SaaS reporting.
“Great for syncing with our GL, automating expense recognition, and helping us track revenue goals with effort.”
–
Marc C.
Comprehensive tools for subscription and revenue management
Several users say Maxio supports large volumes of subscription data, enabling more accurate SaaS metric reporting for finance and operations teams.
“What I like best about Maxio is its robust subscription management capabilities that support both finance and operations teams.”
–
Verified User in Accounting
3. ChartMogul
ChartMogul’s subscription analytics and revenue reporting platform is built primarily for subscription-based businesses.
ChartMogul helps with SaaS reporting by gathering data from billing systems and turning it into consistent metrics like MRR, ARR, churn, and customer segmentation. It aims to help teams make standard reports without having to manually combine data by organizing recurring revenue metrics. It also connects to many billing and payment systems to collect all subscription information.
Users like its pre-set metrics and visual dashboards because they make it easier to set up basic revenue reports. It does the math for metrics and lets you look at cohorts and trends, which makes it easier for finance and operations teams to keep an eye on performance.
ChartMogul connects to common systems to make sure that revenue reports show data directly from billing sources. This makes it easier to see how customers behave and how growth patterns change.
What Users Like About ChartMogul for SaaS Reporting and Metrics
Quick setup that speeds up SaaS reporting
Users say onboarding is straightforward, helping teams start tracking churn and ARR sooner.
“It's extremely easy to set up. We use Chargebee and Quickb...azing job to the team! ”
–
Chris D.
Helpful insights for reporting on SaaS metrics
Users say ChartMogul provides guidance and visibility into SaaS performance, helping teams monitor recurring revenue over time.
“Chart mogul has been a great way to get insights into our ...insight as ChartMogul. ”
–
Nicole R.
Business and finance metrics built for subscription reporting
Reviewers say the platform generates key business and finance metrics that support SaaS subscription reporting workflows.
“It generates all business and finance metrics regarding from a SaaS company directly and seamless.”
–
Victor P.
4. ProfitWell: Subscription Reporting Built for Recurring Revenue
Designed for subscription businesses looking for quick insights into revenue trends and churn, ProfitWell is a freemium subscription analytics and retention tool that offers free reporting dashboards.
ProfitWell Metrics focuses on automated SaaS reporting for metrics like MRR, churn, ARPU, LTV, and retention, which means you don't have to do as many calculations and use as many spreadsheets. This makes it easier for teams to keep their reports on finance, product, and leadership consistent and reliable.
It connects directly to billing systems like Stripe, Chargebee, and Recurly to make real-time SaaS reporting dashboards. When looking at revenue trends, cohort behavior, and churn drivers, users praise its speed, accuracy, and clarity.
Comparing your company's performance to a large dataset of other subscription companies gives you a better idea of how well you're doing. ProfitWell shows how purpose-built reporting can make recurring revenue models easier to see, more consistent, and better for making decisions when teams are looking at SaaS reporting tools.
What Users Like About ProfitWell for SaaS Reporting and Metrics
Clear visibility into growth, churn, and core SaaS metrics
Users say ProfitWell helps them understand key SaaS performance metrics like growth and churn without needing to do additional manual analysis.
“ProfitWell takes your payment processor data and creates really clear insights into growth, churn, and more.”
–
Steve D.
Easy access to KPI insights with minimal effort
Reviewers often highlight how easy it is to find useful SaaS metrics, making it easier to monitor ARR and churn without setting up complex reporting systems.
“I love how super easy it is to get insights into important KPI...rn without any effort! ”
–
Jerre B.
Reporting based directly on payment processor data
Users say ProfitWell connects directly to payment processor data, helping ensure SaaS reporting is grounded in real billing activity.
“At Me And My Golf, meandmygolf.com, we use ProfitWell alongsid...g I really appreciate. ”
–
Paul B.
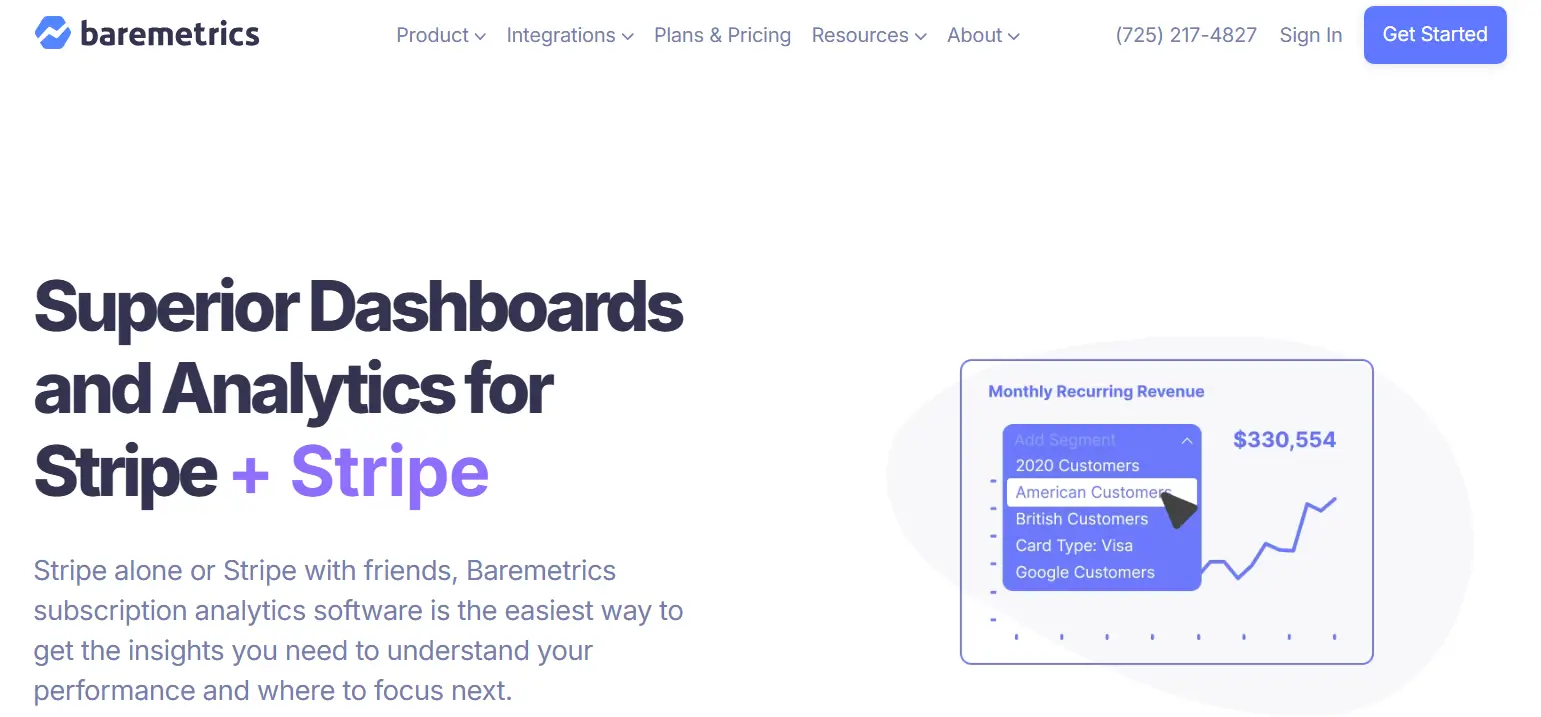
5. Baremetrics: Subscription Metrics and Financial Visibility
Built with simplicity in mind, Baremetrics is a subscription analytics platform designed for small to mid-sized SaaS businesses.
Price
$49 to $749/month
Ideal use case
SaaS businesses that need focused in-depth analytics
Baremetrics is a SaaS reporting tool that focuses on metrics like MRR, ARR, churn, LTV, and ARPU. It connects directly to payment processors and accounting systems, which cuts down on the need to prepare data by hand.
It also provides forecasting tools to help with planning revenue and cash flow. Segmentation tools can help teams look at how customers act and find patterns that explain growth or cancellations.
Some of the user reviews talk about how much time they save by using automated reporting instead of spreadsheets.
What Users Like About Baremetrics for SaaS Reporting and Metrics
A wide range of core SaaS metrics
Users say Baremetrics provides the reports they need to understand recurring revenue, churn, and overall SaaS performance.
“It offers all the reports you want. We're an early stage SaaS company, and it gives us all the metrics we need to understand our business.”
–
Jan Pilgaard C.
Better visibility into cancellations and churn drivers
Reviewers say Baremetrics helps teams understand cancellations, which supports churn and ARR analysis.
“Baremetrics made it easy for us to handle cancellations and get insight into why customers were leaving.”
–
Allison A.
Fast setup with billing providers
Many users say connecting Baremetrics to billing systems is quick, allowing teams to access SaaS metrics sooner.
“Setup with Stripe is effortless, and you don't have to spend time configuring anything.”
–
Saggi N.
Choose a reporting tool that scales with you
The right SaaS reporting tool goes beyond tracking MRR or churn, it connects your entire revenue ecosystem so you can make faster, smarter growth decisions.
Looking across these tools, most tend to excel in only one or two key areas, leaving gaps in others:
ProfitWell, Baremetrics, or ChartMogul work well for early-stage subscription reporting but focus mainly on billing data.
Maxio adds revenue recognition, but its analytics and real-time dashboards are less flexible for growth-stage needs.
Grid is the only platform that unifies sales, billing, and finance data into a single source of truth, providing real-time insights and advanced segmentation that scale seamlessly from $5M ARR to hundreds of millions.
High-growth SaaS companies are building robust reporting foundations today before scaling challenges force reactive decisions. Choosing a tool that scales with your company helps you avoid costly migrations later and positions your business to act on real-time opportunities today.
Co-Founder and CEO at Grid. Ethan has over 10 years of experience in SaaS. He created Grid to help businesses get clear data without having to spend hours wrangling data and writing SQL queries.
More Blog Posts
The sales pipeline metrics you should add to your reporting stack.


%20(2).png)