
SaaSGrid is now Grid! Read about our evolution here.

Every early-stage SaaS founder wonders the same thing: with dozens of metrics to track, which ones actually build investor trust and secure funding? When investors see hundreds of pitches every day, leading with the right metrics demonstrates financial responsibility and long-term growth potential making your company stand out as a reliable investment. These are the numbers investors check when you raise in a downturn.
To answer this question, we sat down with Chris Cheng, Partner at Capital49, a venture fund backed by the $6B global fintech Airwallex. Chris brings over a decade of experience in the financial industry, spanning investment banking, private equity, and venture capital backing household names like Uber and ShipBob.
In this guide, Chris breaks down the four metrics that help businesses optimize their performance, attract investor confidence during their next funding round, and position themselves for scale.
Chris’s journey through investment banking, private equity, and high-growth startups revealed a critical insight: “Clear SaaS metrics are the North Star of every successful business.” Tracking them isn’t just about checking the compass it’s about steering the ship. For example, KPIs like churn and LTV can shape acquisition campaigns, retention strategies, and pricing.
He first applied this approach at Pango, a cybersecurity company with 650M+ VPN downloads acquired by Aura. At that scale, even tiny shifts in key metrics had a significant impact on the company’s financial decisions. As Head of Finance, Chris maintained real-time metrics to spot growth in new customer segments and shift spend accordingly.
But while each metric serves a purpose, his experience as a Principal at Obvious Ventures a fund launched by Twitter Co-Founder Evan Williams equipped him with a deep understanding of which ones best indicate growth potential.
Chris’s experience with high-growth SaaS companies has revealed four key metrics that dictate most investment discussions. Here’s how you can use them to show VCs you’re building a profitable, scalable business.
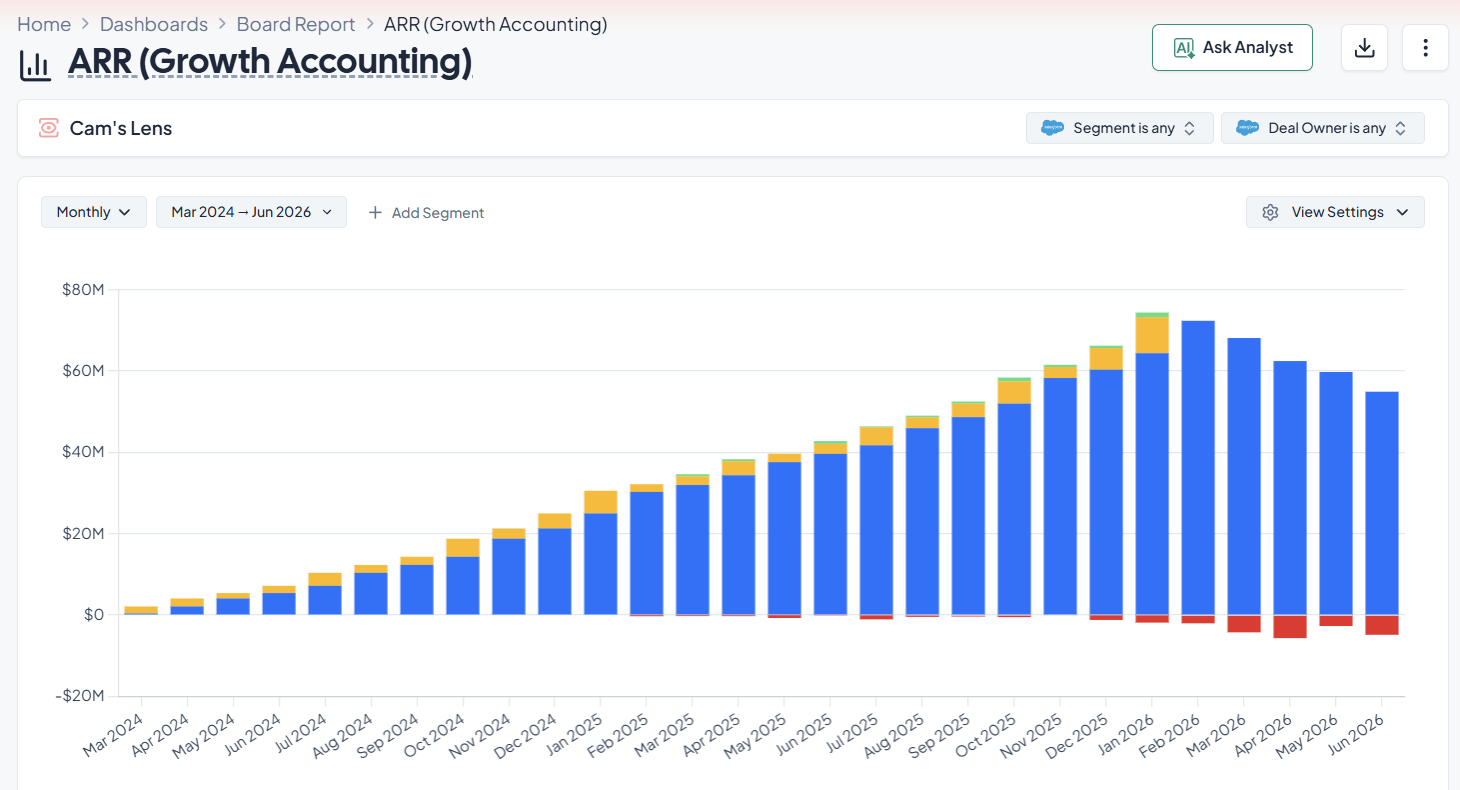
Annualized Recurring Revenue (ARR) represents the predictable, recurring revenue your company can expect from customers. As Chris shares, it’s “the core growth metric VCs want to know right away.” It’s a reliable and straightforward metric for SaaS companies across industries to calculate it, add up all the run-rate subscription revenue.
Investors use ARR to assess the overall demand for your product and the effectiveness of your acquisition efforts. Strong, growing ARR indicates healthy sales momentum and may suggest product-market fit, but it doesn’t provide a complete picture on its own. On the other hand, if ARR is flat or declining, investors may question whether customer churn offsets new sales or if growth initiatives need to be adjusted.
No single metric tells the whole story investors look at ARR alongside churn, LTV, and other metrics to validate growth and retention, which we’ll discuss next.
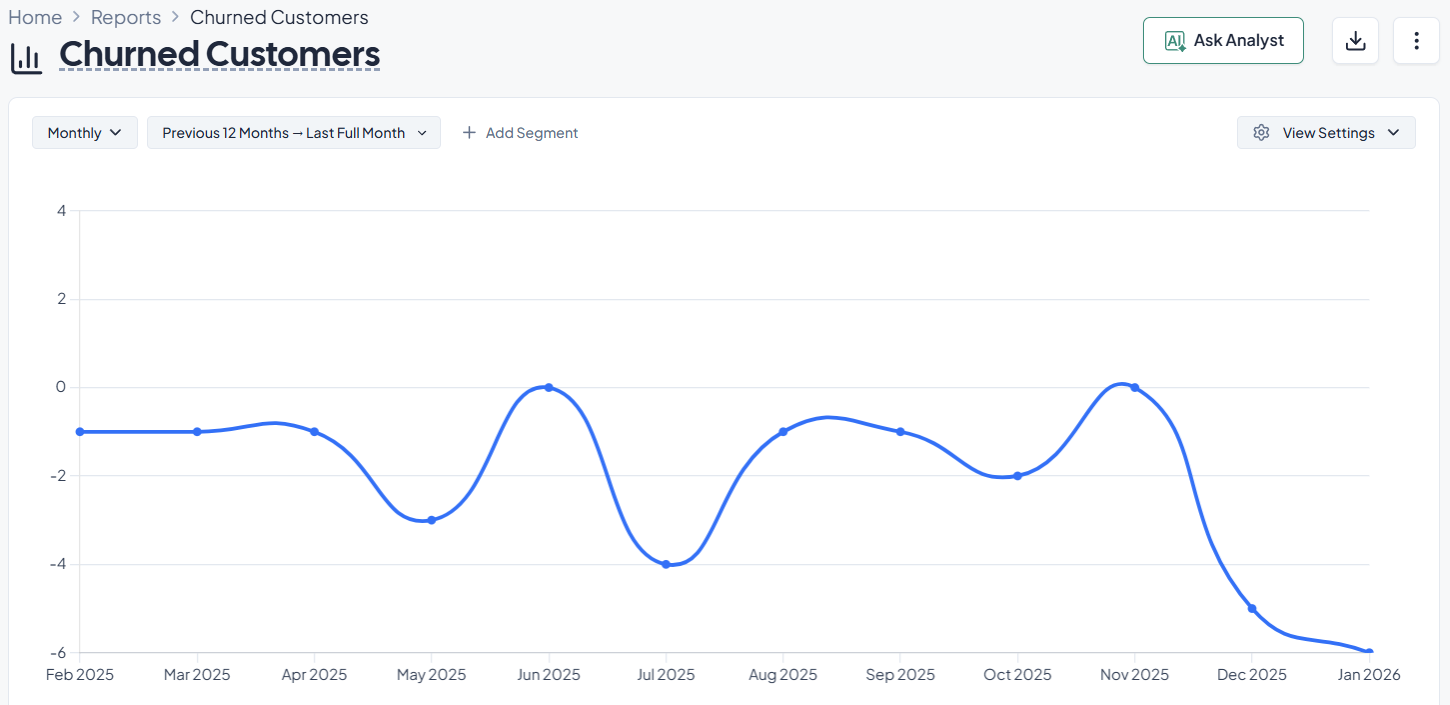
Churn rate measures the percentage of customers who ended their contracts over a given period. Chris treats this metric as a proxy for every company’s product-market fit and customer satisfaction. While covering Uber at SoftBank, he consistently evaluated driver churn to determine if the company’s two-sided marketplace model “had a steady supply” that maintained smooth operations and scale.
Low churn suggests stable revenue streams and a loyal customer base, making it easy for investors to predict returns. Since customer acquisition is more expensive than retention, low churn implies higher margins. On the other side, high churn might suggest that customers are leaving faster than they are replaced. This signals two things to investors: revenue is declining, and the product doesn’t align with the needs of its target market.
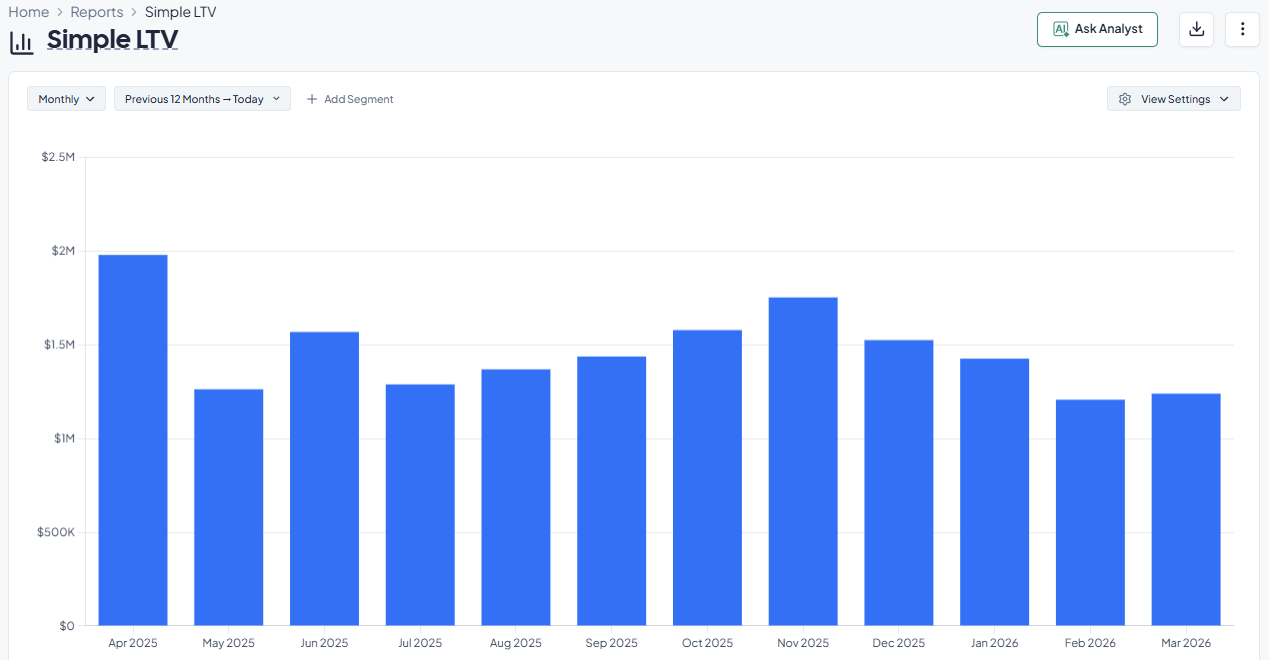
Customer Lifetime Value (LTV) measures the revenue a customer generates over the entire duration of their subscription. Chris points out that LTV is “highly dependent” on the target customer. Throughout his career, he has seen both SMB products whose customers churn after six months and enterprise-focused businesses that lock in multi-year deals.
This variability makes LTV harder to calculate, but also more informative. High LTV signals two things: you’re targeting the right segments, and you know how to nurture them. Conversely, low LTV might indicate underpricing, limited upsell potential, targeting low-value segments, or most importantly a lack of delivery of tangible value to customers. Any of these factors can make investments in growth especially risky.
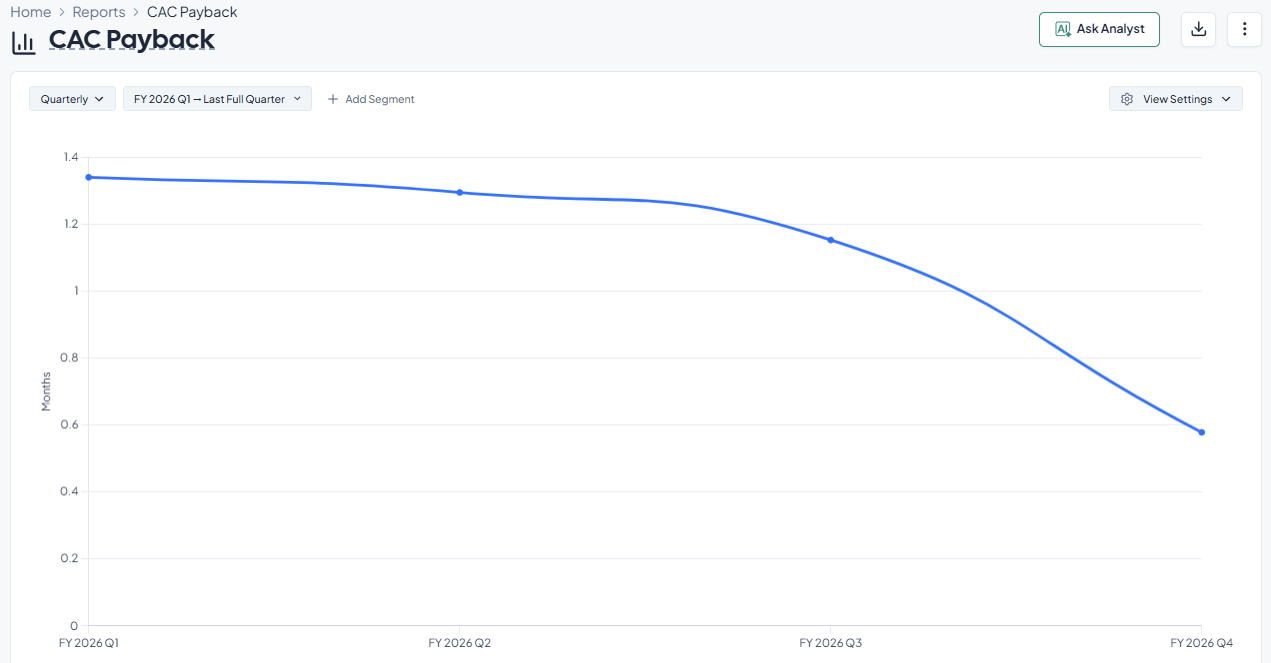
CAC Payback Period is the number of months it takes for a company to earn back what it spent to acquire a new customer. Widely regarded as “the best measure of sales efficiency,” this metric instantly tells investors if the business can sustain itself without burning cash.
Shorter payback periods show that you’re pricing appropriately and managing your acquisition resources efficiently. They also allow you to generate profits sooner, so you can reinvest in growth more quickly. However, longer CAC Payback Periods often hint at poor unit economics, where high marketing and sales spend drives cash burn.
Even when you have the right metrics, building reports that meet investor standards isn’t always straightforward. In Chris’s experience, there are three common pitfalls that can throw off your numbers.
The good news? You can avoid them with the right approach.
Using the same formulas and definitions as your investors is key to building credibility with your reporting. Yet, Chris notes that many SaaS teams operate with inconsistent calculations.
For example, some SaaS companies base LTV on revenue, while others use gross profit. This distinction can significantly change how healthy a business appears to investors, complicating industry benchmarking and undermining fundraising efforts.
How to avoid: Align with internal teams and board members around standardized definitions and formulas for key SaaS metrics. Ensure these guidelines are well-documented and communicated across the company.
Standardizing your metrics is especially important if you serve SMBs or mid-sized businesses. “Investors find businesses with enterprise customers easier to evaluate because their year-long deals generate predictable, fixed-term revenue,” explains Chris. “However, other customer segments tend to be more volatile, making KPIs like LTV and CAC Payback particularly sensitive to small changes.”
Many companies default to spreadsheets for early-stage SaaS reporting. Even at Pango, which had 650M+ users, Chris calculated metrics by pulling warehouse data and writing SQL queries. However, he cautions that these systems do not scale with your business so knowing when it’s time to upgrade is critical.
“When you need speed, efficiency, and accuracy, manual reporting quickly becomes overwhelming,” he shares. “Tracking performance through SQL took hours but we didn’t have any other option available at the time.”
How to avoid: Invest in dedicated SaaS reporting tools early on. These solutions consolidate and analyze data from your key data sources automatically, minimizing the risk of data discrepancies and human error.
By streamlining your reporting process, you also prevent unnecessary resource drain to focus on growth-generating activities. With the right tools, you can provide investors with instant visibility into performance, signaling that “you have a strong command of the business,” and building trust and confidence in your business.
“Investors expect real-time growth, efficiency, and pipeline KPIs,” highlights Chris. “This level of visibility helps them understand your financial position and assess your runway.” But if you calculate metrics with data you exported days ago, you risk sharing outdated insights.
His experience at Pango underscored the value of real-time data. When political events caused a sudden spike in VPN usage, he needed answers immediately: What does this mean for their growth trajectory? How will it impact profitability? Without this data, it would have been impossible to inform investors about the company’s outlook.
How to avoid: Use your reporting platform to create real-time performance snapshots for external stakeholders. For example, build a dashboard with the four key metrics they look for, or showcase your efficiency by bundling LTV, CAC Payback Period, and LTV:CAC ratio. Look for advanced tools offering customizable permission settings so investors can explore the data on their own.
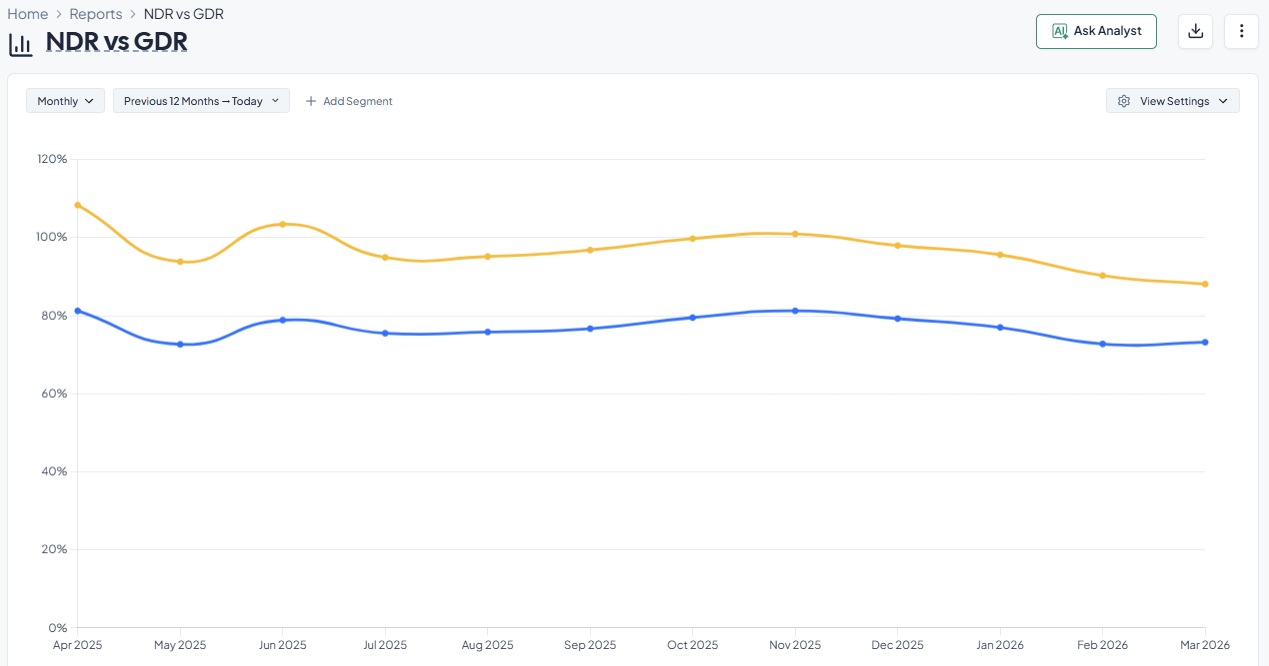
Retention metrics show investors how long a SaaS revenue base is likely to last. Investors often look at two metrics at the same time.
These two metrics answer different questions.
GRR shows the leaks in the bucket. It tells investors how much revenue the company would lose if it did not sell additional products to existing customers. If GRR declines, it often signals product issues, pricing problems, or customer dissatisfaction.
NRR shows the engine’s power. A high NRR indicates that expansion revenue from existing customers more than offsets churn. Companies with NRR above 100 percent demonstrate that their installed base grows over time.
Investors typically examine both metrics together. GRR highlights the stability of the core product. NRR reveals whether the company can expand revenue from existing customers.
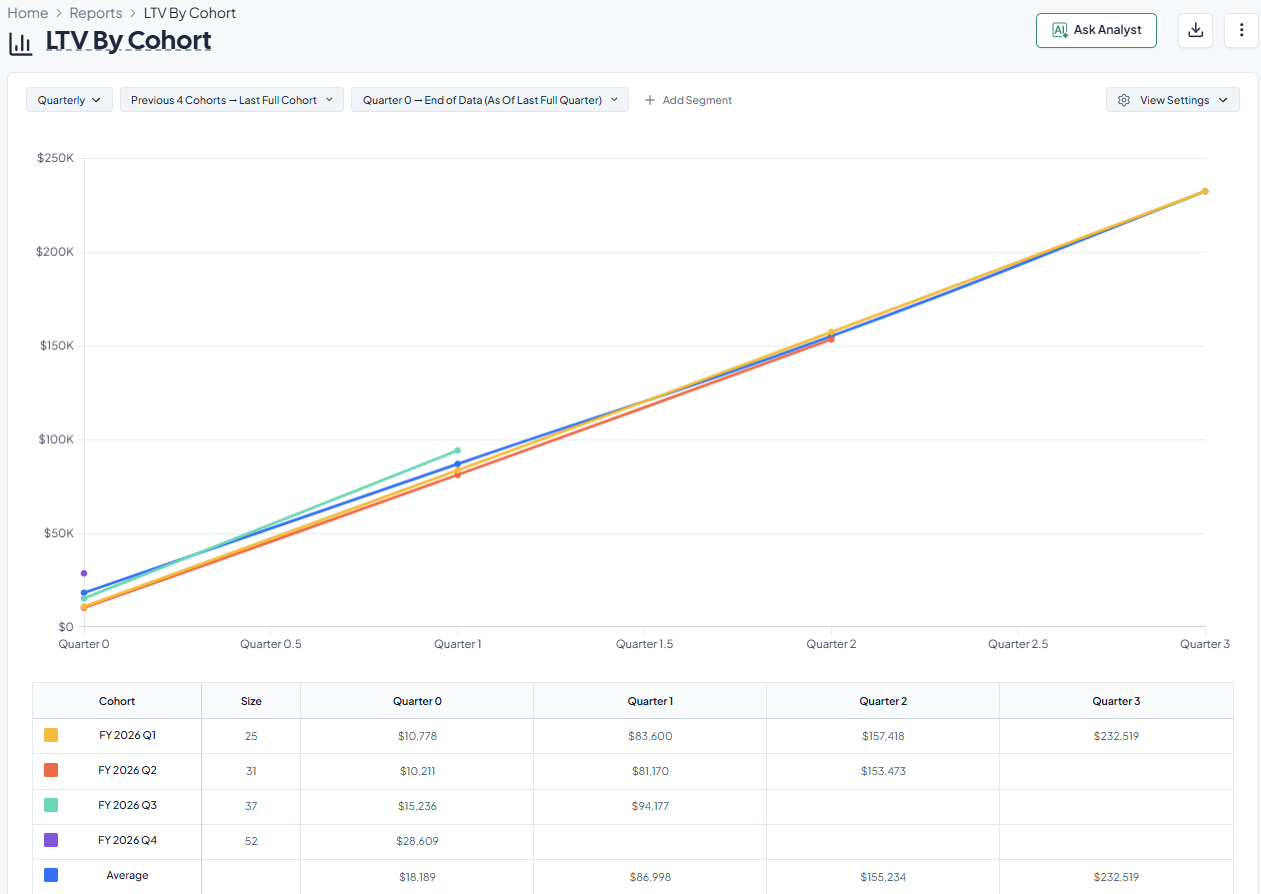
Cohort analysis tracks groups of customers based on the period when they first subscribed. Each group is monitored over time to observe retention, revenue growth, and churn patterns.
A typical cohort analysis follows this structure:
| Customer Cohort (Signup Month) | Month 1 Revenue | Month 3 Revenue | Month 6 Revenue | Month 12 Revenue |
|---|---|---|---|---|
| January Customers | 100% | 95% | 90% | 82% |
| February Customers | 100% | 96% | 91% | 85% |
| March Customers | 100% | 97% | 92% | 88% |
Tracking cohorts helps the finance and product teams figure out when churn happens. For Example:
Investors often look at cohort charts to see if retention rates go up for new groups of customers after changes to the product or prices.
The SaaS Magic Number shows how well spending on sales and marketing leads to new recurring revenue.
A simplified formula is:
Magic Number = (New ARR generated in a quarter) / (Sales and Marketing spend in the previous quarter)
A result of about 1.0 or higher usually means that growth is happening quickly. It says that every dollar spent on sales and marketing brings in about one dollar of new annual recurring revenue within a year.
You can use this metric to guide spending decisions.
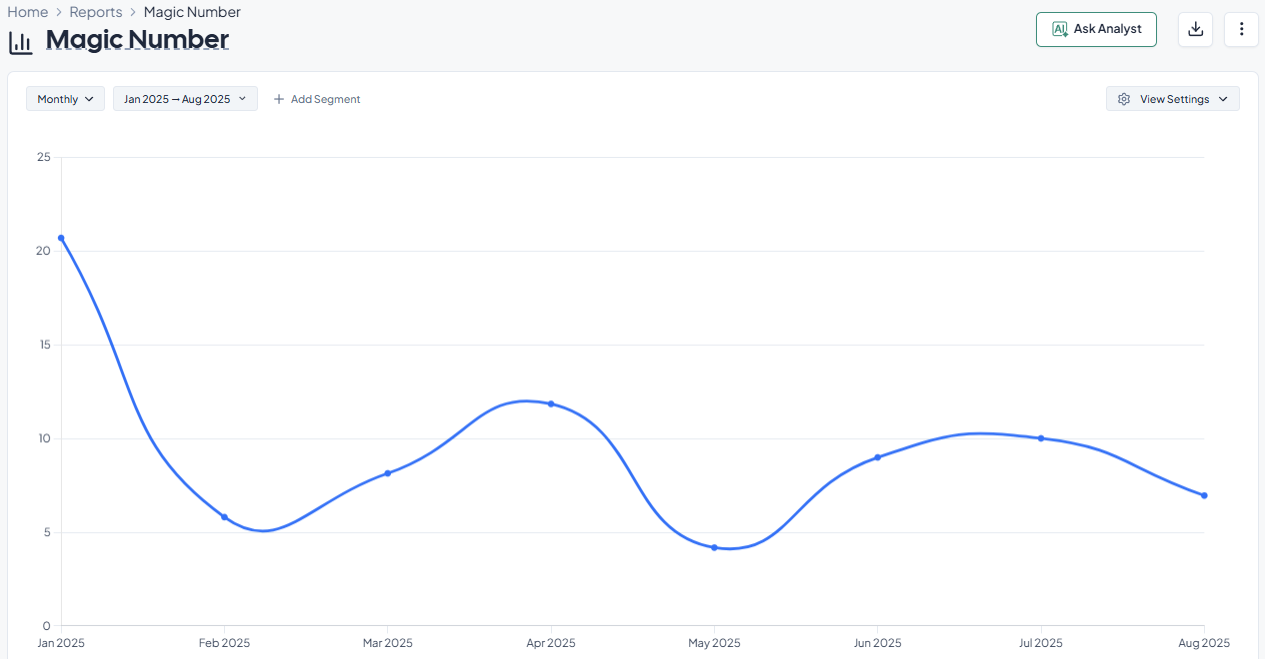
This metric helps answer a practical question: How much capital does it take to produce each dollar of recurring revenue growth?
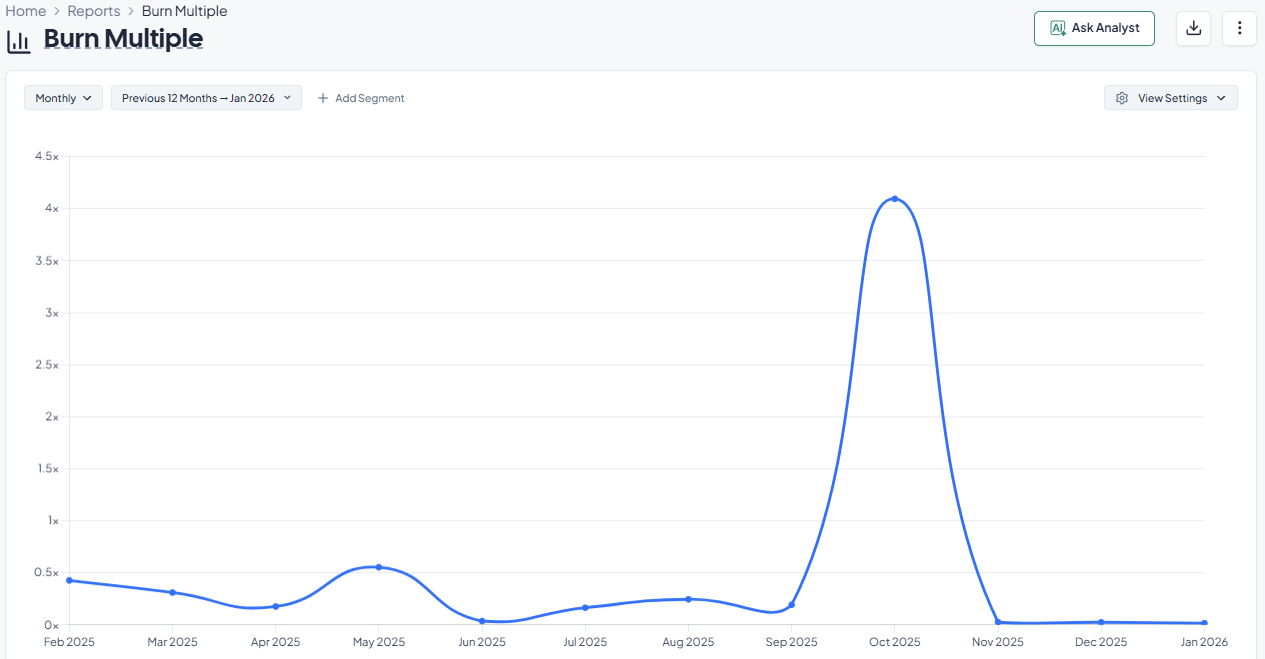
Burn Multiple measures how efficiently you’re converting cash burn into new recurring revenue growth.
Burn Multiple = Net Cash Burn / Net New ARR
For example:
Lower burn multiples indicate higher efficiency. In tighter funding environments, investors often favor companies that generate ARR growth while limiting cash burn.
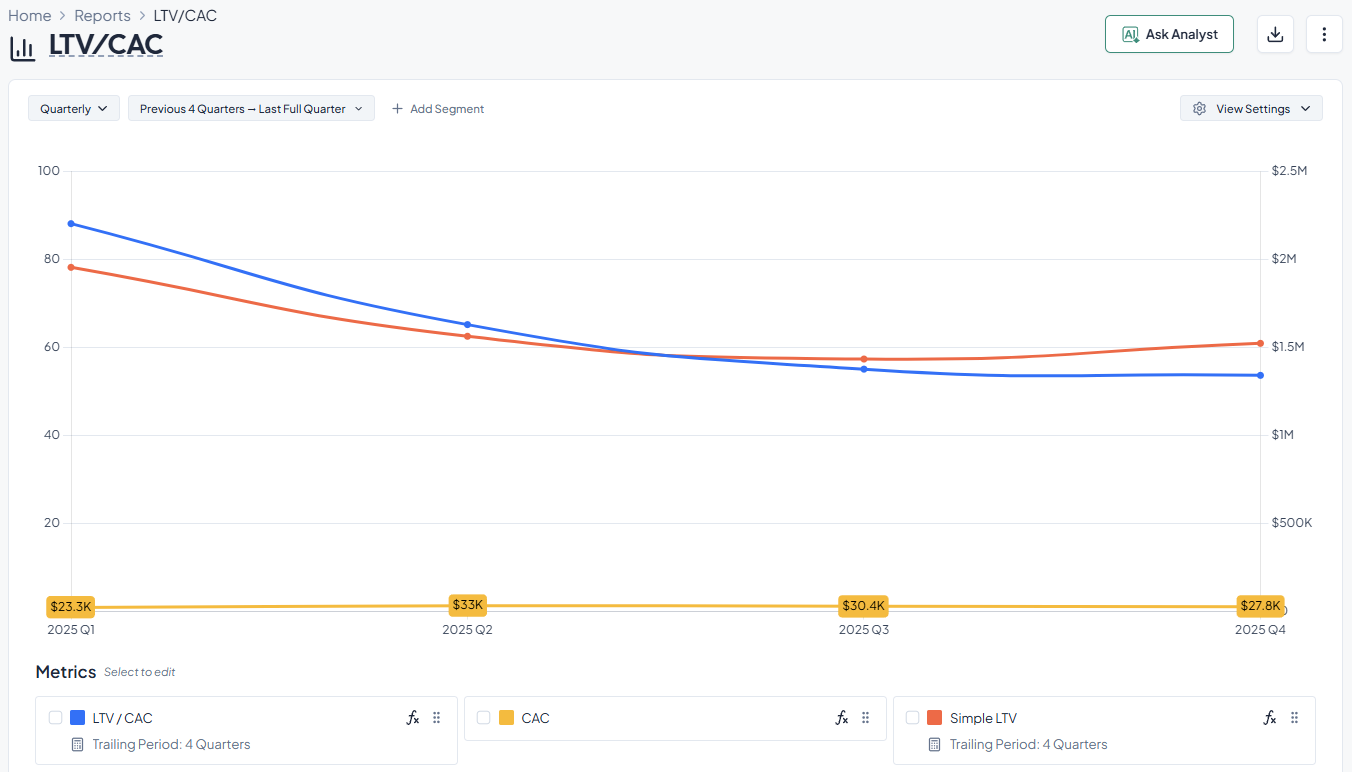
The LTV-to-CAC ratio compares the lifetime value of a customer to the cost required to acquire that customer.
LTV-to-CAC = Customer Lifetime Value / Customer Acquisition Cost
A ratio of 3:1 is widely viewed as the industry benchmark. It means the revenue generated by a typical customer is three times greater than the cost of acquiring that customer.
This ratio matters because it captures several elements of SaaS performance at once:
Your company is spending more to get customers than those customers are worth if the ratio is less than 1.
If the ratio is much higher than 3, your company might be able to invest more in sales to speed up growth.
Grid gets you out of the weeds of manual data analysis with consistent, investor-grade reporting. With the platform, you can:
If you want to optimize your SaaS reporting and build investor trust, Grid can help. Book a demo today.


Plus now you can easily generate them using our secret sauce Grid.
Compare five SaaS tracking tools and see how they handle metrics, usage, costs, and reporting across teams.

After hearing the feedback from our customers, we're excited to finally share our all-new AI Analyst, which is available to all Grid users today.

We’ve outlined five key criteria that separate truly scalable reporting platforms from tools you’ll outgrow in 12 months.

