SaaSGrid is now Grid! Read about our evolution here.
Here's the thing about data in general: it's easy to produce a lot of it and still not know what to do with it. You can pull a report, run a model, generate a dashboard, and end up with a pile of numbers that nobody synthesizes into an actual answer. The same trap applies to your sales funnel. Tracking ten metrics badly is worse than tracking four well, because the ten give you the illusion of rigor without the substance of it.
So this isn't a list of every metric a SaaS company could theoretically track. It's the ones that tell you, stage by stage, where your funnel is working and where it's quietly leaking revenue, along with what to actually do once you know.
If you're borrowing a funnel framework from a different industry, drop it. In most sales funnels, the purchase is the finish line. In SaaS, the purchase happens in the middle. The real value of a customer, and the real test of whether your go-to-market motion works, gets decided in the months and years after the deal closes, through renewal, expansion, and retention.
That distinction matters more for a specific kind of company: teams selling into finance and revenue operations, where the buyer isn't managing vendor spend, they're managing the contracts that drive their own company's ARR and renewal forecasting. If you sell that kind of software, your funnel metrics need to connect cleanly to the metrics your buyer already lives in, because that's the language they'll use to justify the purchase internally.
Keep that in mind as you build out the stages below. Each one needs an owner, a target, and a clear next action when the number moves in the wrong direction.
The first stage answers a simple question: are enough of the right people finding you?
This tells you whether your top-of-funnel content and targeting are attracting people who actually fit your ICP, or just generating volume for volume's sake. A low rate usually means one of two things: your targeting is too broad, or your messaging isn't speaking to a real pain point.
Segment this rate by channel and by content type before you touch your ad spend. A channel that produces a lot of leads but a low MQL rate is quietly wasting budget, no matter how good the raw traffic numbers look. Reallocate toward the channels where your ICP is already self-selecting.
This is where most of the real diagnostic work happens, because this is where a lead either becomes revenue or goes cold.
If this number is low, your sales team is spending time on leads that were never going to close, and your marketing team is getting credit for volume that doesn't convert. Get sales and marketing in a room and agree on a shared definition of "qualified" before you argue about whose fault the number is.
It measures the average time from first contact to closed deal. This isn't just a sales metric, it's a cash flow metric. A lengthening cycle means capital gets tied up longer before it turns into revenue, which matters just as much to your finance team as it does to your VP of Sales.
Here's where a lot of teams get this wrong, they look at win rate as one number instead of breaking it down by segment, deal size, and lead source. A 25% blended win rate might be hiding a 45% win rate in your core ICP and a 10% win rate in a segment you should stop chasing entirely.
Pipeline velocity is the one number that tells you how fast money is actually moving through your funnel, and it's calculated from the metrics above:
The reason this metric matters more than any single stage number is that it forces you to isolate which input actually broke when velocity drops. Did the number of qualified opportunities fall? Did win rate slip? Did deals just start taking longer to close? Each of those has a different fix, and a blended velocity number won't tell you which one to chase.
Structuring pipeline and reporting metrics by rep, region, and product is usually what surfaces which input actually moved.
Growth by itself doesn't tell you whether your business model works. Growth relative to what you spent to get it does.
Customer Acquisition Cost (CAC) is your fully burdened sales and marketing spend divided by the number of new customers acquired.
Average Revenue Per Account (ARPA) = New ARR ÷ Number of New Customers
CAC Payback Period = CAC ÷ (Monthly ARPA × Gross Margin %)
This tells you how many months it takes to recoup what you spent acquiring a customer. Twelve to eighteen months is a reasonable benchmark for most B2B SaaS, though this stretches longer for enterprise deals. If your payback period is drifting past that range, you're tying up more capital for longer, which changes how much runway your growth plan actually needs.
None of these numbers are useful in isolation, and this is exactly where a lot of finance and RevOps teams get stuck: the inputs live in five different systems, and by the time someone stitches them together by hand, the number is already stale. Deciding which of the broader SaaS metrics that matter earn a permanent spot on your dashboard, versus a quarterly check-in, usually comes down to which ones your board actually asks about.
Remember, the SaaS funnel doesn't end at close. It ends at renewal, if it ends at all. The metrics after the sale often say more about your business's health than anything upstream of it.
Net Revenue Retention (NRR) measures revenue retained from your existing customer base, including expansion, minus churn and contraction. Above 100% means your existing customers are growing your revenue even before you close a single new logo.
Gross Revenue Retention (GRR) strips out expansion and just measures what you kept. This is the floor metric, and it's the one that catches a dangerous blind spot: NRR can look healthy while you're quietly losing logos, because expansion from your remaining customers is masking the churn.
Expansion ARR is the increase in a customer's ARR from their starting value. If most SaaS companies get their revenue growth predominantly from upsells and renewals rather than new logos, this number deserves the same rigor as your top-of-funnel metrics, not an afterthought in a board deck.
Getting these numbers right depends on your CRM data actually being clean and complete in the first place, which is its own problem for a lot of RevOps teams. Most of that comes down to whether Salesforce is set up to function as a revenue engine rather than just a contact database, since that's what determines whether NRR and expansion numbers are trustworthy in the first place.
There's a simple mistake that undoes most of the work above: tracking each of these metrics in a different tool, owned by a different team, with no shared source of truth. Marketing owns MQL data in one platform, sales owns pipeline data in the CRM, finance owns retention data in a spreadsheet, and nobody sees the full funnel in one place.
That's how you end up with a lot of reporting and very few decisions. Pick the four or five metrics from each stage above that actually match your business model, assign an owner and a target to each one, and put them somewhere your whole revenue team can see in real time. Turning that list of formulas into an actual operating rhythm is really a question of sales pipeline management, not just reporting.
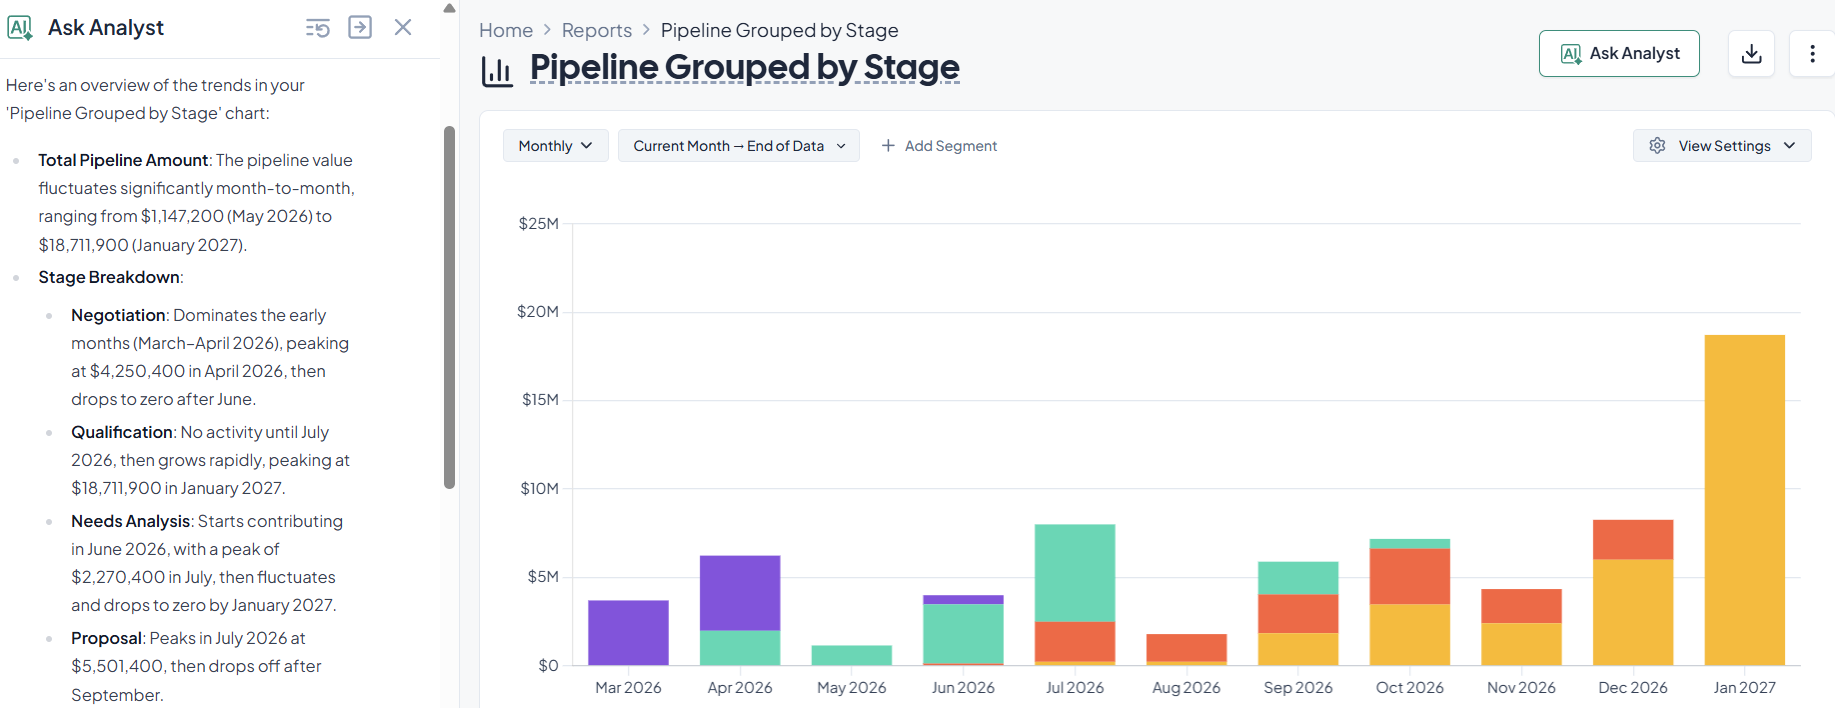
Your pipeline is more than a list of deals, it's a dynamic system that drives revenue growth. Grid provides a real-time view into your deal flow, letting you track every stage of the sales process. Quickly spot trends, measure pipeline velocity, and identify bottlenecks before they cost you conversions. Easily filter by rep, region, or product to unlock actionable insights. Give your sales team the clarity they need to close more deals, faster.
Visualize Every Deal in Motion: Track deals across each stage of your pipeline with live updates. From first touch to closed-won, always know where every opportunity stands.
Uncover Funnel Conversion and Velocity Insights: Measure conversion rates and pipeline velocity with precision. Identify delays, optimize handoffs, and accelerate the path to close.
Segment Pipeline Performance for Deeper Insights: Break down your pipeline by sales rep, region, product, or team. Get the context you need to coach better, forecast smarter, and sell more effectively.
Talk to us to see how Grid can help you track your pipeline.

Your business needs accurate ARR tracking, see how these reporting tools compare and which fits your revenue model, data complexity, and reporting needs.
Payment reconciliation is one of those finance tasks that sounds simple until you actually have to do it at scale.
There's no universal good CPA number. If someone gives you a flat dollar figure without asking about your ACV and your retention first, they're guessing. Ignore it.

After hearing the feedback from our customers, we're excited to finally share our all-new AI Analyst, which is available to all Grid users today.