SaaSGrid is now Grid! Read about our evolution here.
We wanted to publish real gross margin benchmarks the same way we did for retention, growth, and burn: pull the number straight from connected accounting data across our customer base, no surveys, no self-reporting.
What we found wasn't a margin benchmark. It was a much more useful data point about why most SaaS companies can't actually answer "what's our gross margin" with any confidence.
The standard formula for gross margin is pretty straightforward:
Just input the numbers and calculate, right? Not really, because it seems like most companies are having trouble keeping up with their real COGS number.
Looking at the data from 131 companies we found something weird. Across the companies with active ARR, about a quarter of them report exactly $0 in COGS. Not a small number, just zero. That's not a company with perfect unit economics, that's a company whose chart of accounts never created a COGS bucket at all, or one where hosting and delivery costs are sitting somewhere else entirely, usually R&D or G&A.
Among the 100 companies that do report a nonzero COGS figure, the picture doesn't get more believable. The computed gross margin comes in between 96% and 99.5% across the middle of the distribution, with a median around 98.5%.
If you've read any SaaS benchmark report before, that number should stop you. No credible source puts typical SaaS gross margin anywhere near 98%.
The honest read isn't that our customers are unusually efficient. It's that COGS in most companies' books isn't capturing the actual cost of running their product. The clearest tell is what happens when we break this out by company size.
Gross margin should move meaningfully as a company scales, the same way we saw retention and burn multiple move across cohorts in our broader benchmarks work. Instead it barely shifts.
That's a half-point spread across companies at wildly different stages of infrastructure maturity, engineering headcount, and hosting spend. A real efficiency metric doesn't sit still like that, a miscategorized one does.
The published benchmarks found on the web are fairly consistent with each other, which makes our own numbers stand out even more.
Baremetrics puts the industry median gross margin around 73%, with most VCs and SaaS operators targeting 80% or higher. CloudZero's 2026 benchmark data breaks it out by stage: early companies under $5 million in ARR typically run 50-65%, growth-stage companies between $5-50 million sit at 65-78%, and mature companies above $50 million reach 75-85%+.
Benchmarkit's 2025 report puts the median public SaaS gross margin at 77%, though that figure actually dropped four points year over year as computation and AI-related infrastructure costs rose.
The range across every source sits somewhere between 50% (early-stage floor) and roughly 85% (mature ceiling). Nobody credible is publishing numbers in the high 90s, which is exactly why our own dataset's near-ceiling result reads as a data quality issue rather than a genuine finding.
We don't think this data proves SaaS companies have secretly better margins than the industry believes. We think it proves something more useful: most companies are working from a COGS number that doesn't reflect reality, and they may not know it.
This tracks with what other sources in this space flag directly. CloudZero's research describes "inconsistent or incomplete COGS" as one of the most common gross margin pitfalls, pointing specifically to teams that underreport COGS by leaving out cloud infrastructure, DevOps support, and third-party dependencies.
Baremetrics makes the same point from a different angle, warning that it's easy for SaaS companies to leave engineering, hosting, and customer support costs out of COGS entirely, which inflates the reported margin and creates a false picture of scalability.
Put those two observations next to our data and the story writes itself. A quarter of our sample reports zero COGS. The rest cluster near a ceiling that no credible source treats as realistic. That's not 130 unusually efficient companies. That's a widespread accounting blind spot playing out at scale, the same blind spot the rest of the industry has been warning about, just now visible in real numbers instead of anecdote.
If your own gross margin looks implausibly high, this is worth checking before you celebrate it. The SaaS metrics that actually matter are only useful when the inputs behind them reflect what's actually happening in the business, and gross margin is one of the easiest metrics to get quietly wrong.
If any of the numbers above sound uncomfortably close to your own books, the fix is straightforward, even if it takes some real effort to apply consistently.
Most SaaS finance teams have never formally defined this, which is exactly how costs drift into R&D or G&A by default rather than by decision. At minimum, that definition should include cloud hosting and infrastructure, third-party services required to run the product, customer support tied directly to delivery, DevOps and SRE time spent on uptime, and payment processing fees. If it's a cost you'd stop incurring the moment you stopped serving customers, it belongs in COGS.
Go line by line through R&D and G&A and ask whether anything sitting there is actually a delivery cost wearing a different label. This is usually where the biggest gap shows up, engineering time in particular tends to get grouped entirely under R&D even when a meaningful share of it is uptime and support work that's really a cost of delivery.
A COGS definition that changes quarter to quarter makes your gross margin trend meaningless even if any single month looks reasonable. Revisit the definition when your architecture or support model changes, not every time someone closes the books.
Engineering usually knows where infrastructure spend is actually going better than finance does, and finance usually has visibility into how costs get categorized that engineering doesn't. A short recurring review between the two catches drift before it compounds into a full year of misclassified costs.
Manual COGS tracking in a spreadsheet is exactly how a company ends up with a literal $0 in that line item and nobody notices for two quarters.
This is the specific problem Grid is built to solve. Pulling live data directly from Stripe, QuickBooks, Salesforce, and HubSpot into one place means your COGS categorization stays consistent month over month instead of depending on whoever happens to be doing the books that quarter, and a number that suddenly drops to zero or spikes gets surfaced immediately instead of sitting unnoticed until a board meeting or a diligence process finds it.
None of this is about making your gross margin look better. It's about making it real, so that when you look at the number, it's actually telling you something you can act on.
Gross margin isn't just an accounting line item. It's the number that tells you how much of every dollar of revenue is actually available to fund growth.
A company with a healthy gross margin has a real budget left over for sales, marketing, and product investment after covering the direct cost of delivering the product. A company with a weak one is funding growth out of a much thinner slice of each dollar, which shows up eventually in slower hiring, tighter marketing budgets, or more fundraising pressure.
It also shows up directly in valuation. Companies with gross margin above 80% have traded at meaningfully higher revenue multiples than companies below 60%, according to recent public SaaS data, a gap that can represent a large share of a company's enterprise value at scale.
Investors and acquirers treat gross margin as a proxy for how repeatable and scalable the business actually is, which is exactly why an inflated number from bad categorization is worse than a low number from real costs. A low real number is a problem you can see and fix. An inflated fake number is a problem hiding in plain sight until diligence finds it.
In a manufacturing or retail business, cost of goods sold is usually obvious: materials, production labor, shipping. The number is tangible and hard to miscategorize because it maps directly to a physical unit changing hands. SaaS doesn't have that advantage.
The Cost Of Goods Sold for software is a mix of things that don't feel like production costs in the traditional sense: cloud hosting, infrastructure, customer support that keeps the product running, and the engineering time spent on uptime and delivery rather than new features. None of that has the same intuitive, tangible boundary that a factory's bill of materials has, which is exactly why it's so easy for finance teams to bucket those costs into R&D or G&A instead of COGS without realizing the downstream effect on their margin number.
This is also why SaaS gross margin has so much more room to run than a typical industrial business. Once the product is built, serving one more customer costs a fraction of serving the first, since there's no physical unit to manufacture or ship. That's the entire premise behind the 70-85% benchmarks in the previous section. But that same structural advantage is precisely what makes it easy to lose track of your real number: when marginal costs are already low, a few miscategorized line items are enough to push a company's reported margin from a realistic 75% into an implausible high 90s, without anyone noticing the number stopped meaning anything.
Gross margin is one of the most important numbers in a SaaS business and one of the easiest to get quietly wrong. Our own data made that case better than we expected to: a quarter of our customer base reports no cost of delivery at all, and the rest cluster near a ceiling that doesn't move with company size, which is the opposite of what a real efficiency metric should do.
The fix isn't complicated, but it does take deliberate effort: build a COGS definition that actually includes hosting, infrastructure, support, and delivery-related engineering time, apply it consistently, and revisit it as your architecture and support model change. A gross margin number you can trust is worth far more than a flattering one you can't.
Talk to us to see how Grid can help you track gross margin and COGS accurately.

When we pulled real gross margin data from 130+ SaaS companies, the numbers came back too good to be true. Are you making the same COGS tracking mistake?
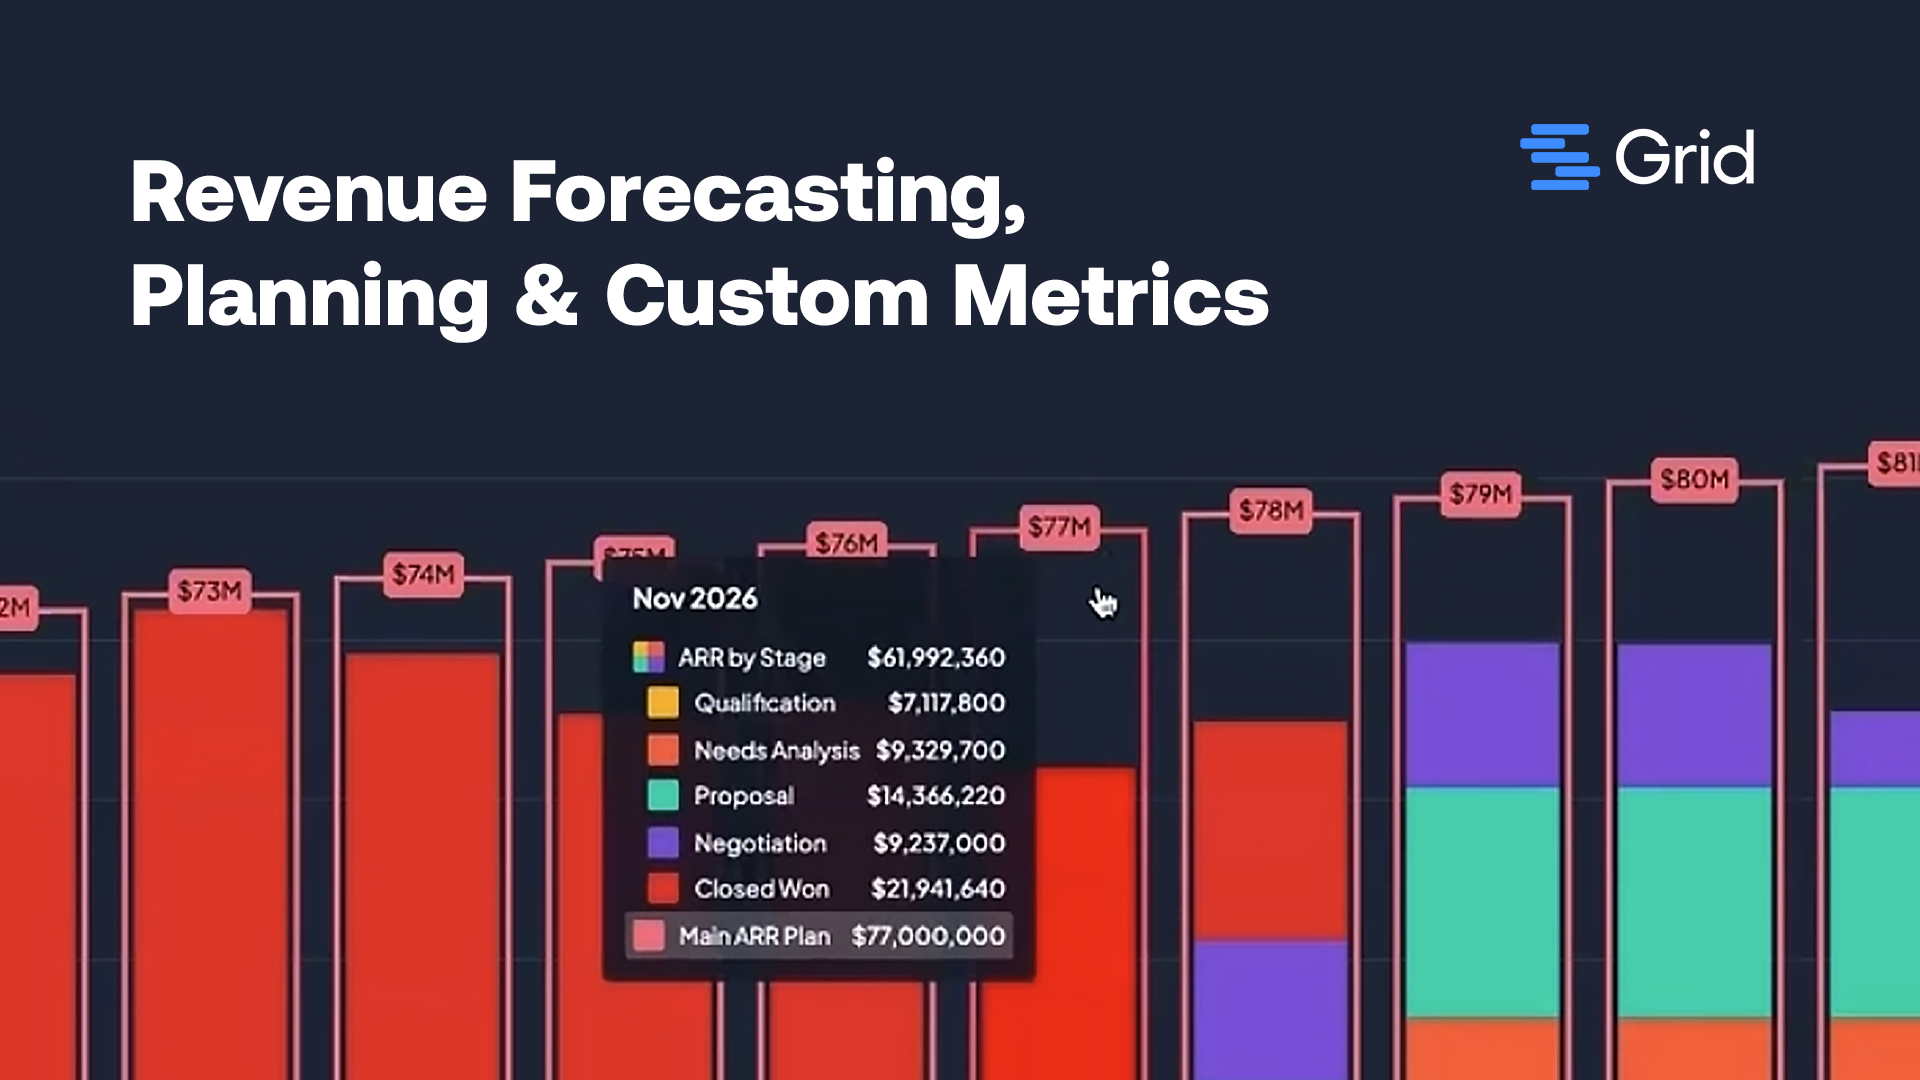
How mid-market teams can simplify forecasting by combining operational metrics, ARR projections, and plans in Grid.

Learn how to make custom metrics in Grid with our brand-new Custom Metrics formula builder!

Methods, models, and examples to help SaaS leaders plan growth, manage risk, and make smarter decisions.